Trading GameStop with VWAP
A series of chart examples from January 22nd to Feburary 2nd, 2021.
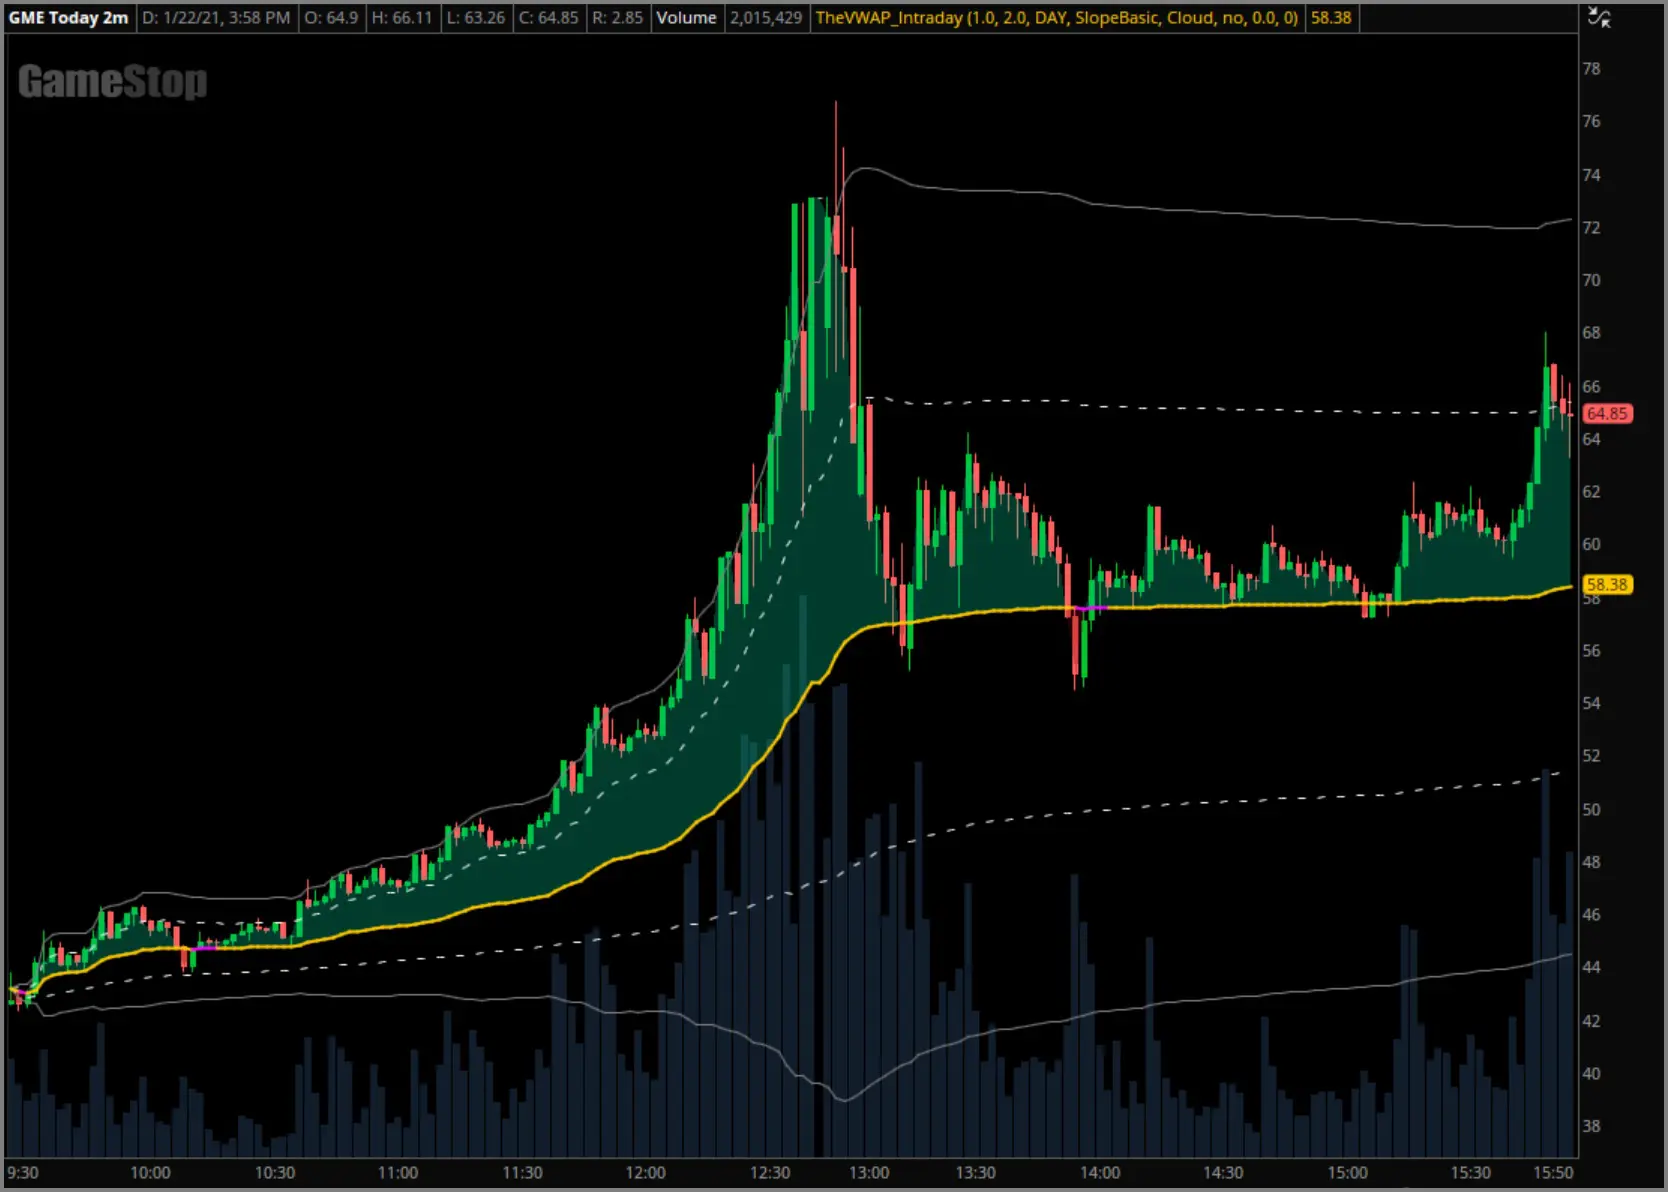
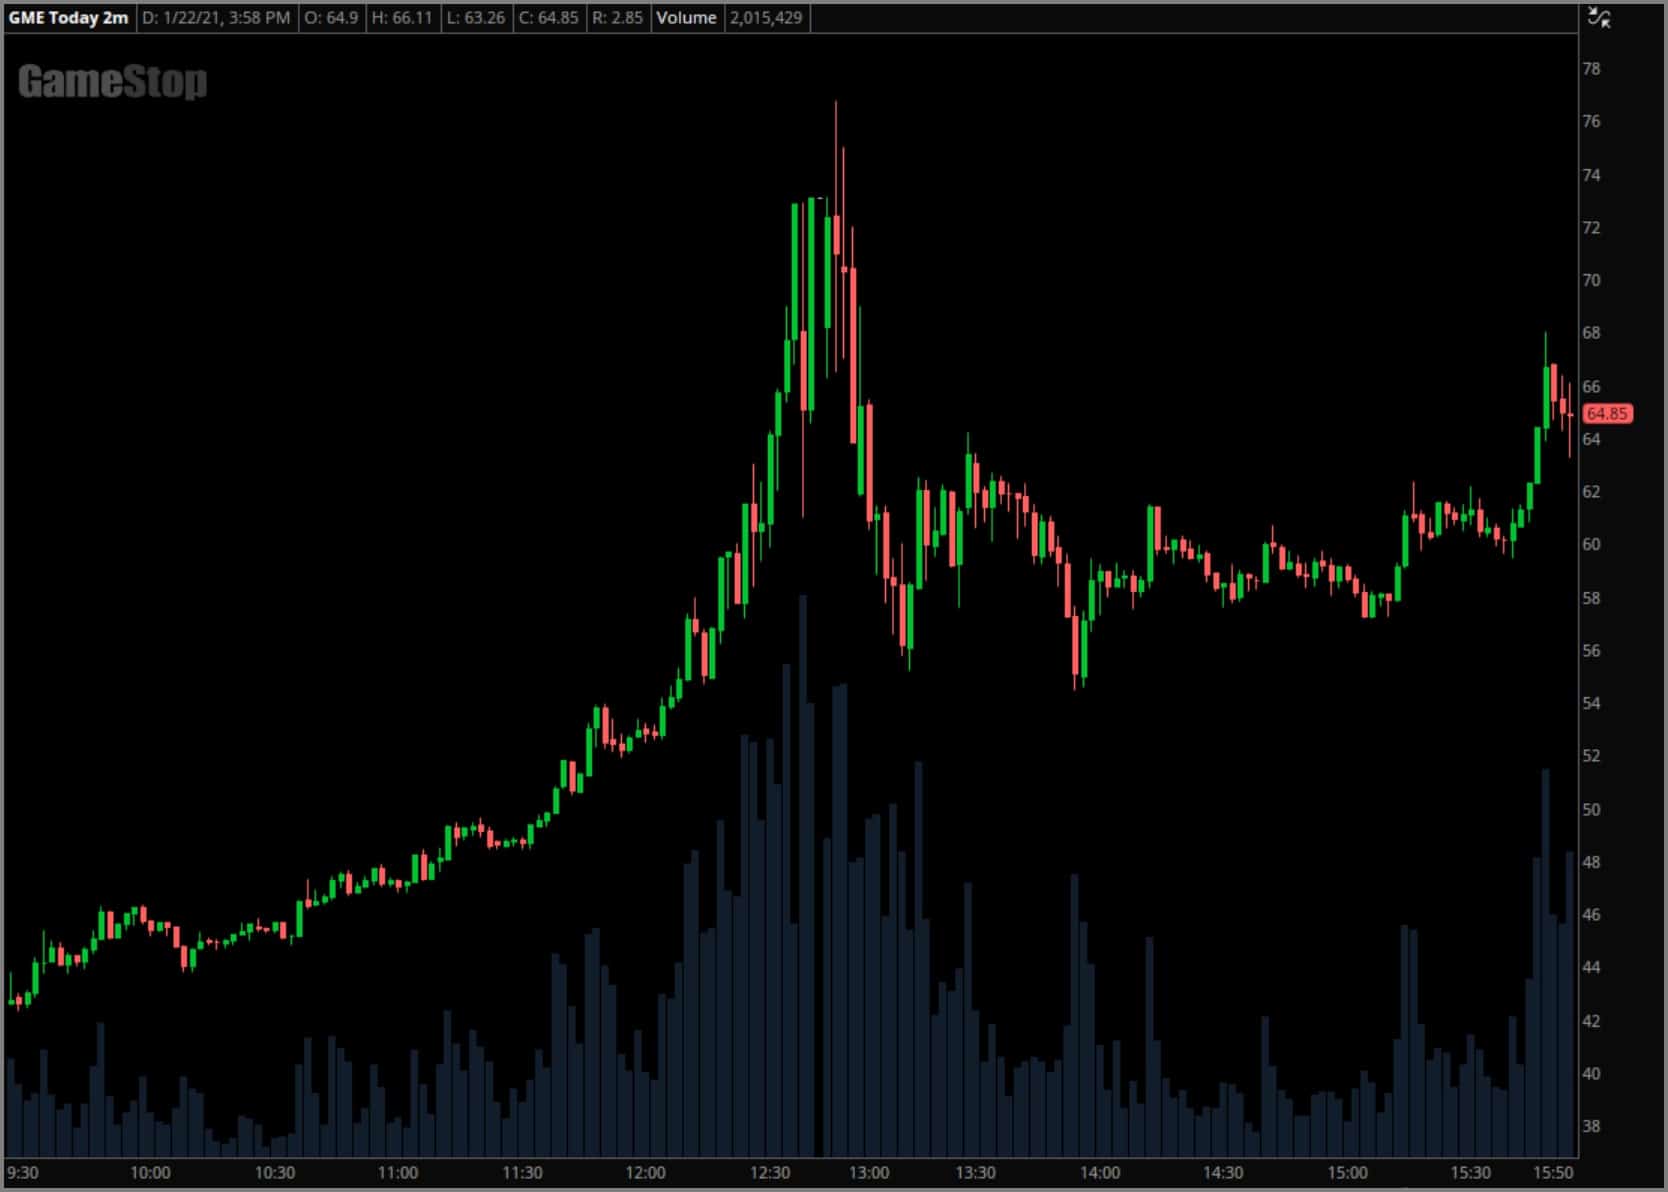
January 22, 2021
This was the highest-volume day of the entire saga, and in some ways signified the real start of the short
squeeze to come. GME spent the previous five days in the $35-$45 range, but reached an intraday high of $76.76 on the 22nd. As evidenced by the chart, things started heating up just
after 11:00am ET with the +1 deviation band playing a vital role in the midday surge.
The 22nd was a Friday, so we headed into the weekend with the buzz of nearly 200 million shares traded and
an all-time high being reached.
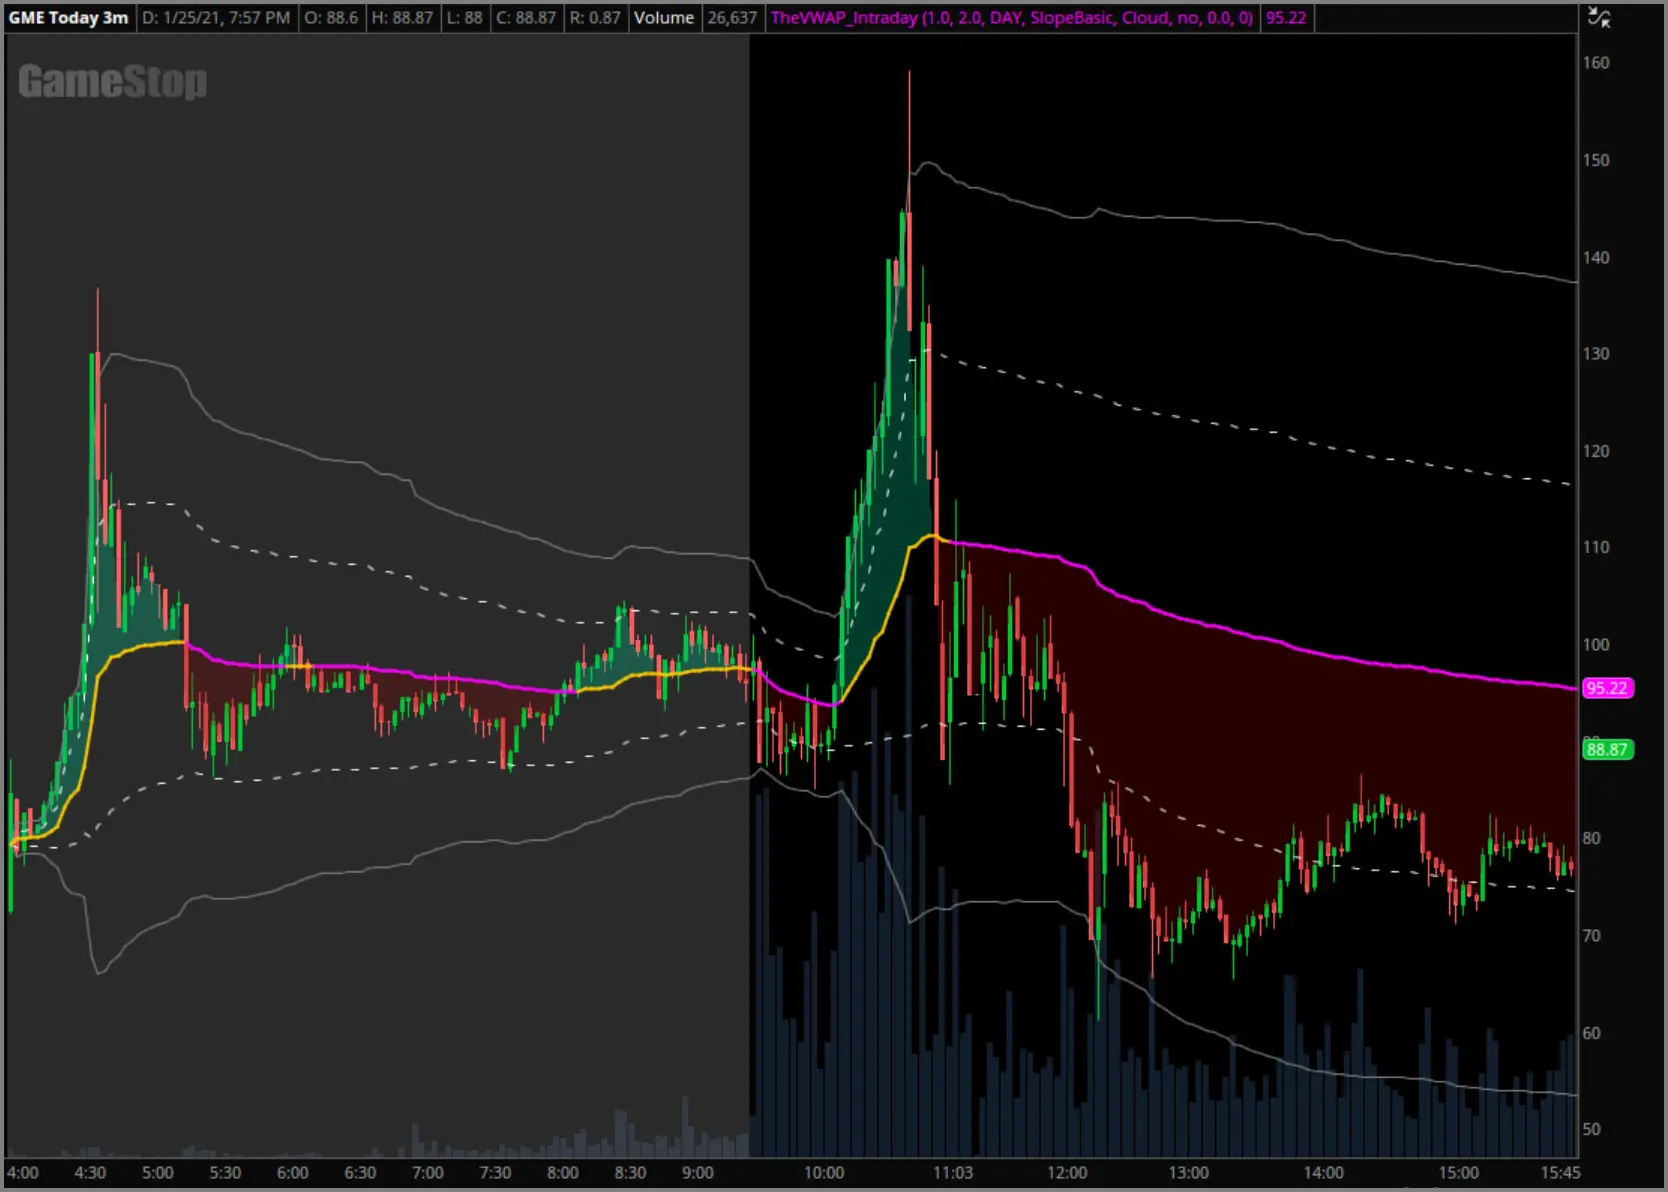
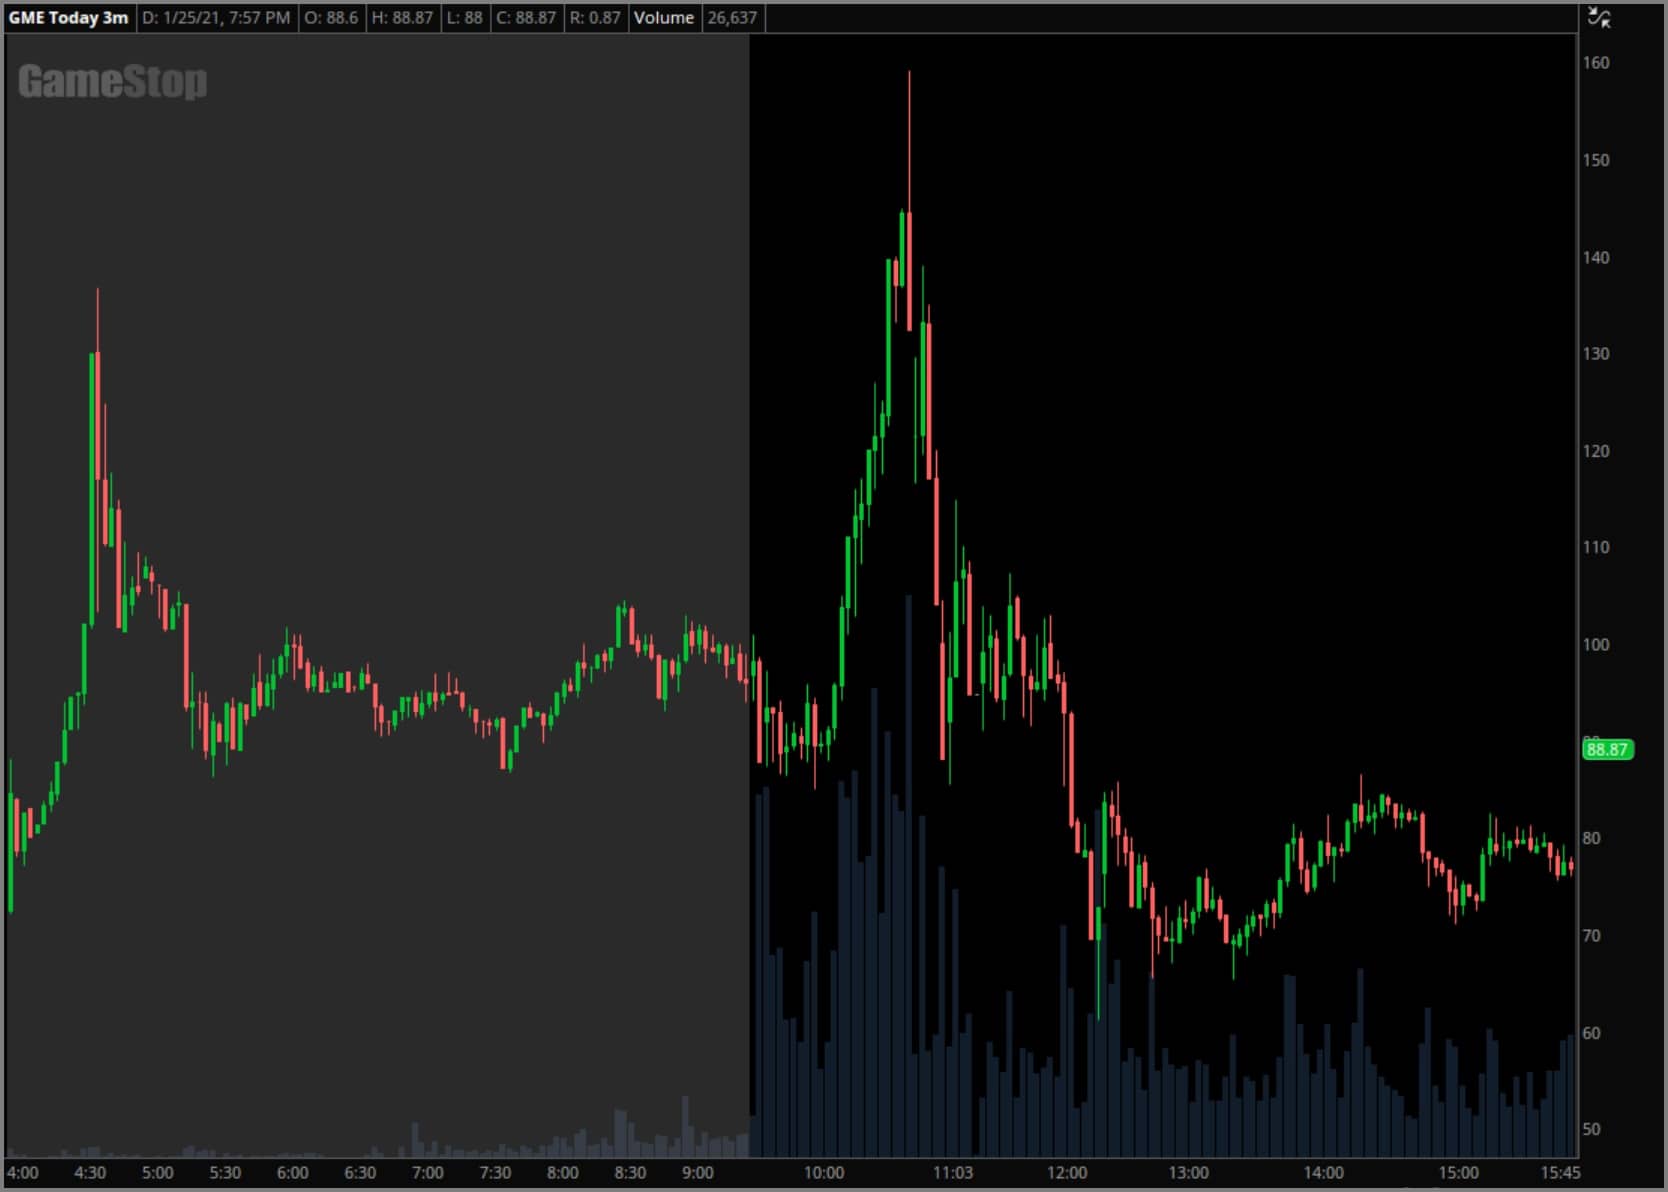
January 25, 2021
GME opened at 4:00am ET on the following Monday at 72.50, but within 40 minutes had ramped to a high of
136.63 before fading back down to intraday VWAP. The impact of VWAP over that entire premarket period is
fairly self-evident, and that influence continued into regular trading hours where price was squeezed to a
new all-time high of nearly 160 before once again fading.
The session closed with price hovering around the low of day, but once again continued to drift higher
overnight.
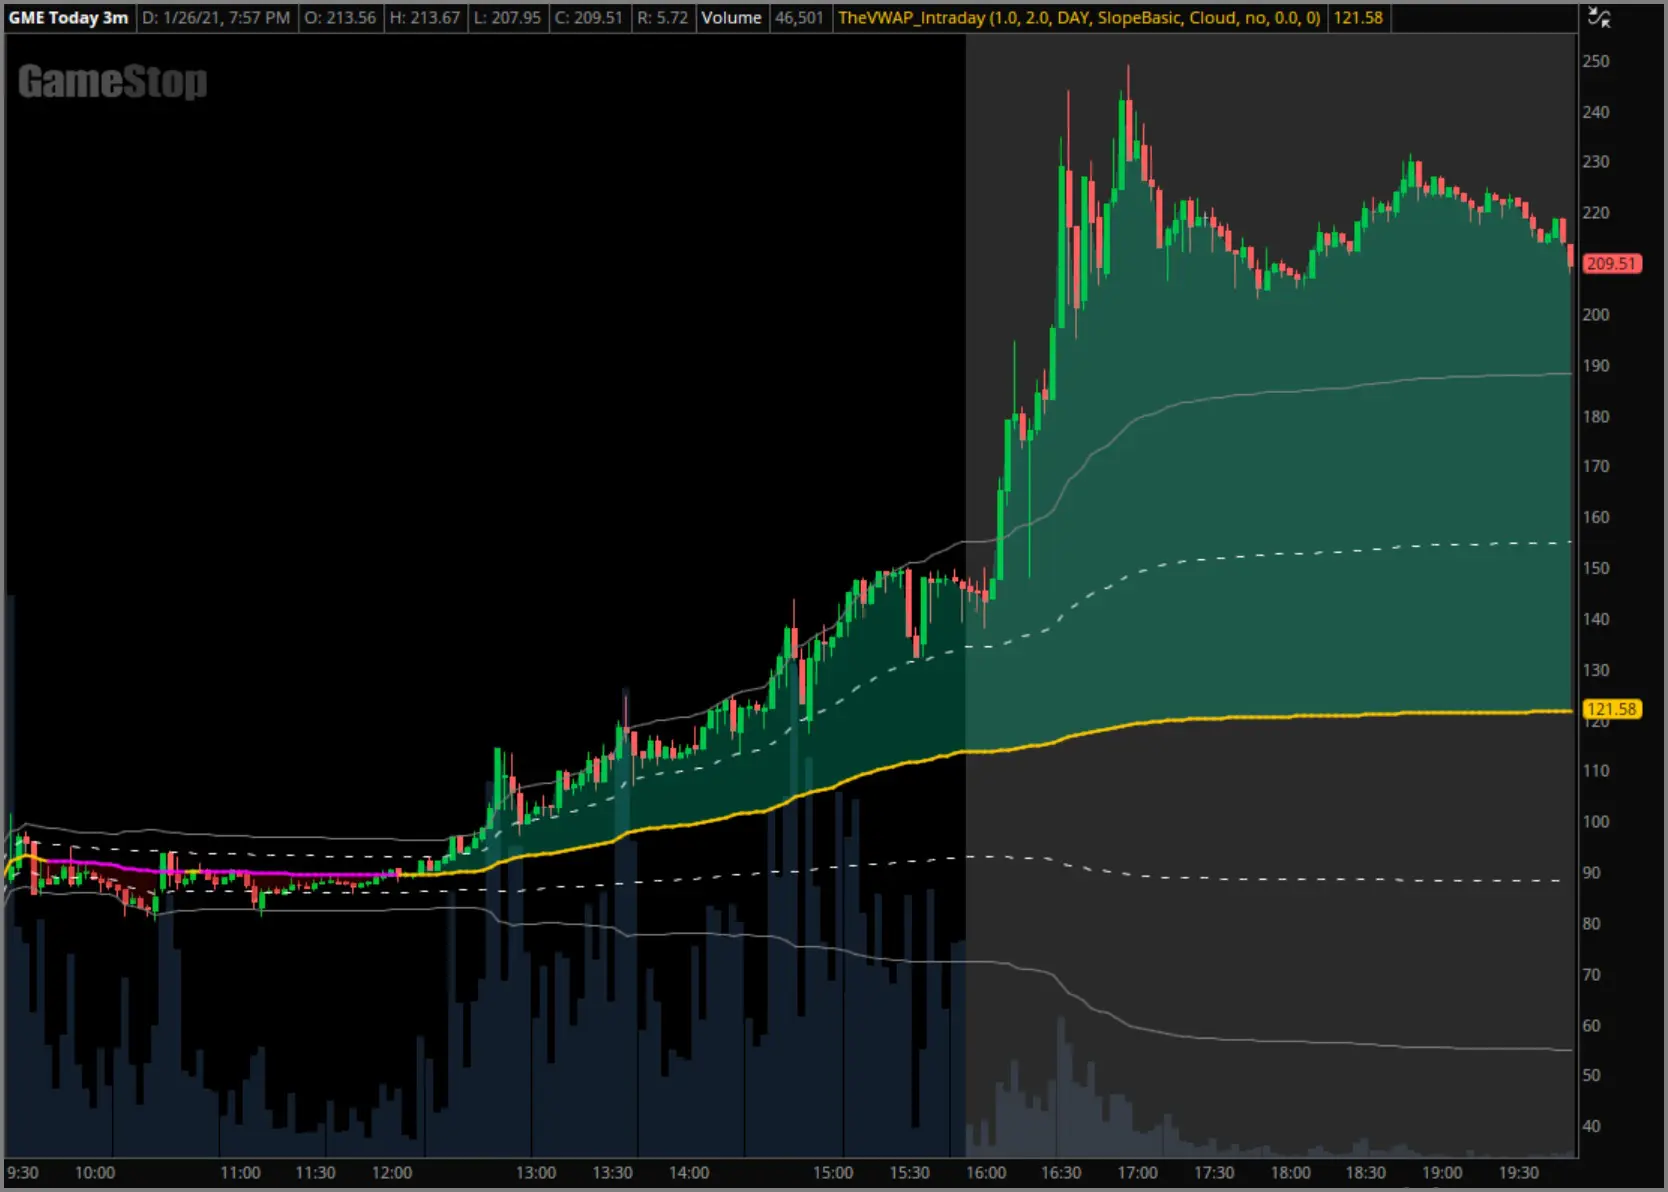
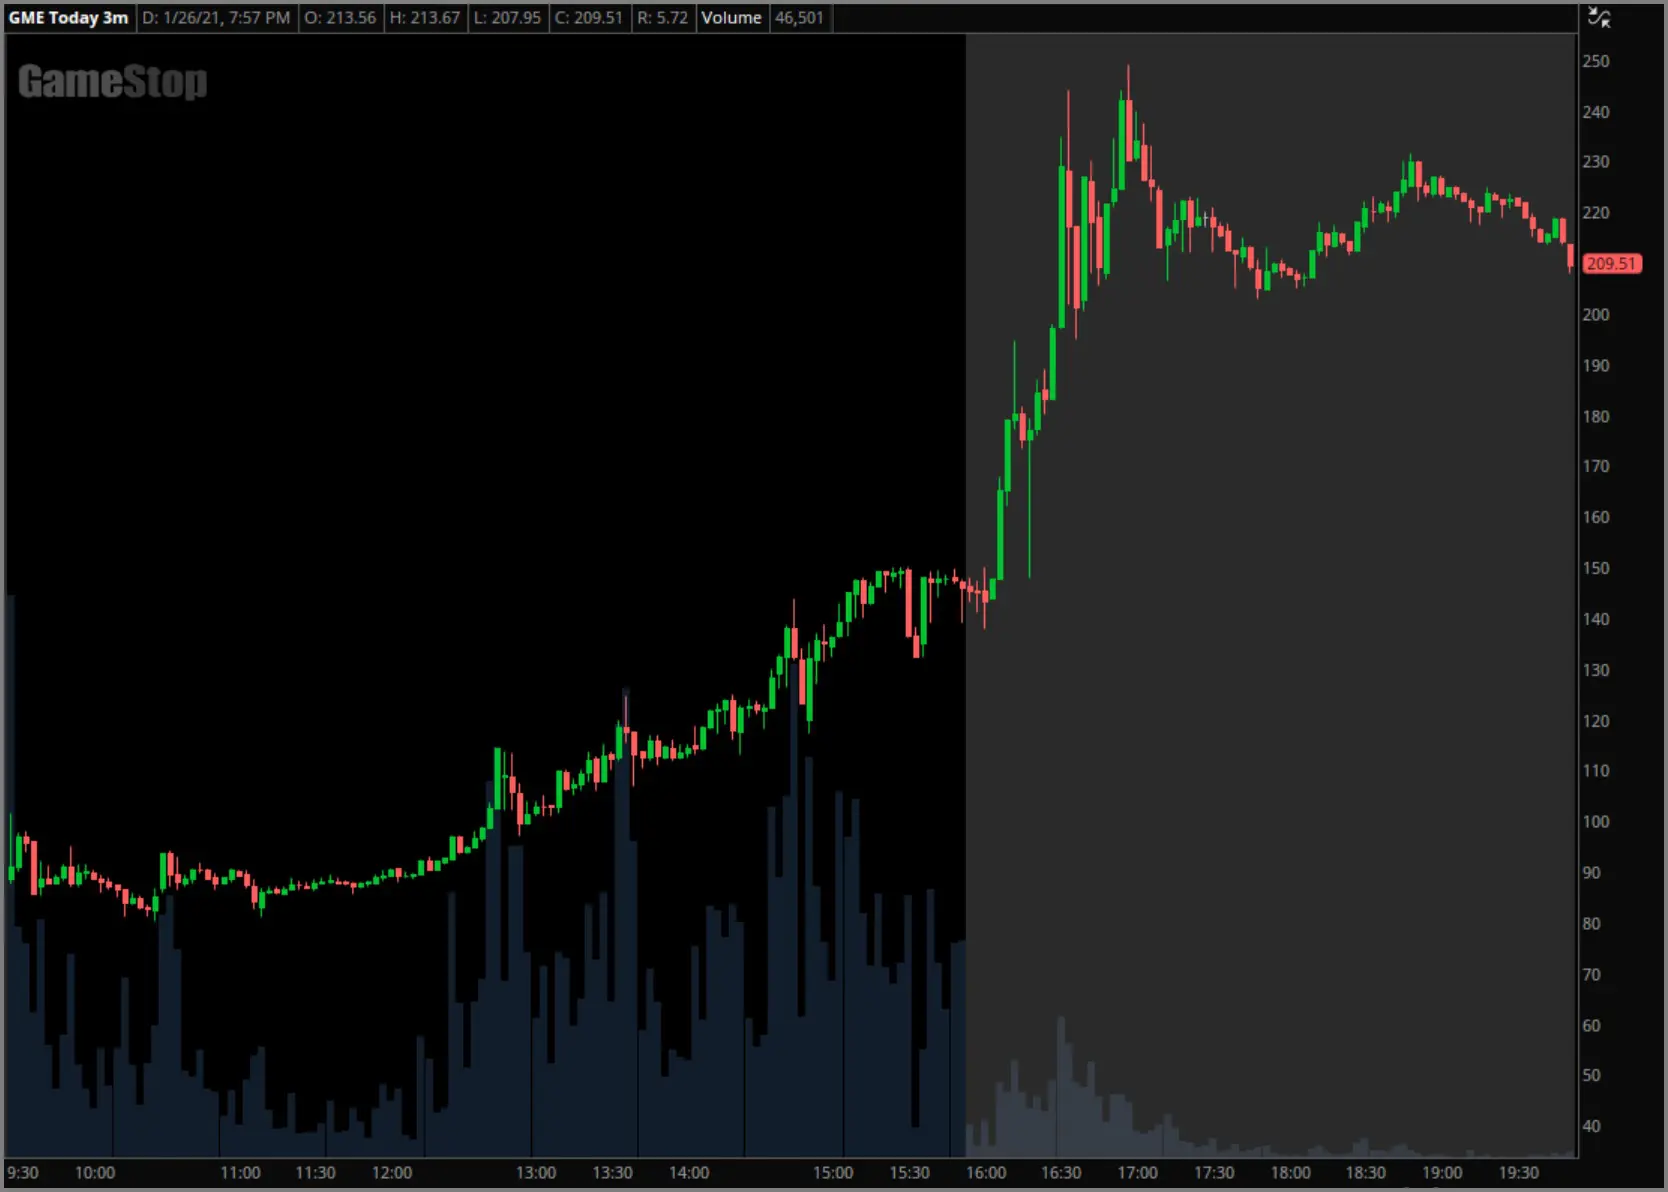
January 26, 2021
The first half of the 26th was largely consolidation and channel trading around intraday VWAP, but around
12:30 ET broke to a new high and heavier volume began to pour in. Another squeeze was ignited, and the +1
deviation band helped guide a sustained uptrend that continued into post-market trading — where a high of
248.90 was reached.
Price movement in the first half of the day was largely unpredictable, but the afternoon surge provided
multiple controlled pullbacks along the way to yet another all-time high.
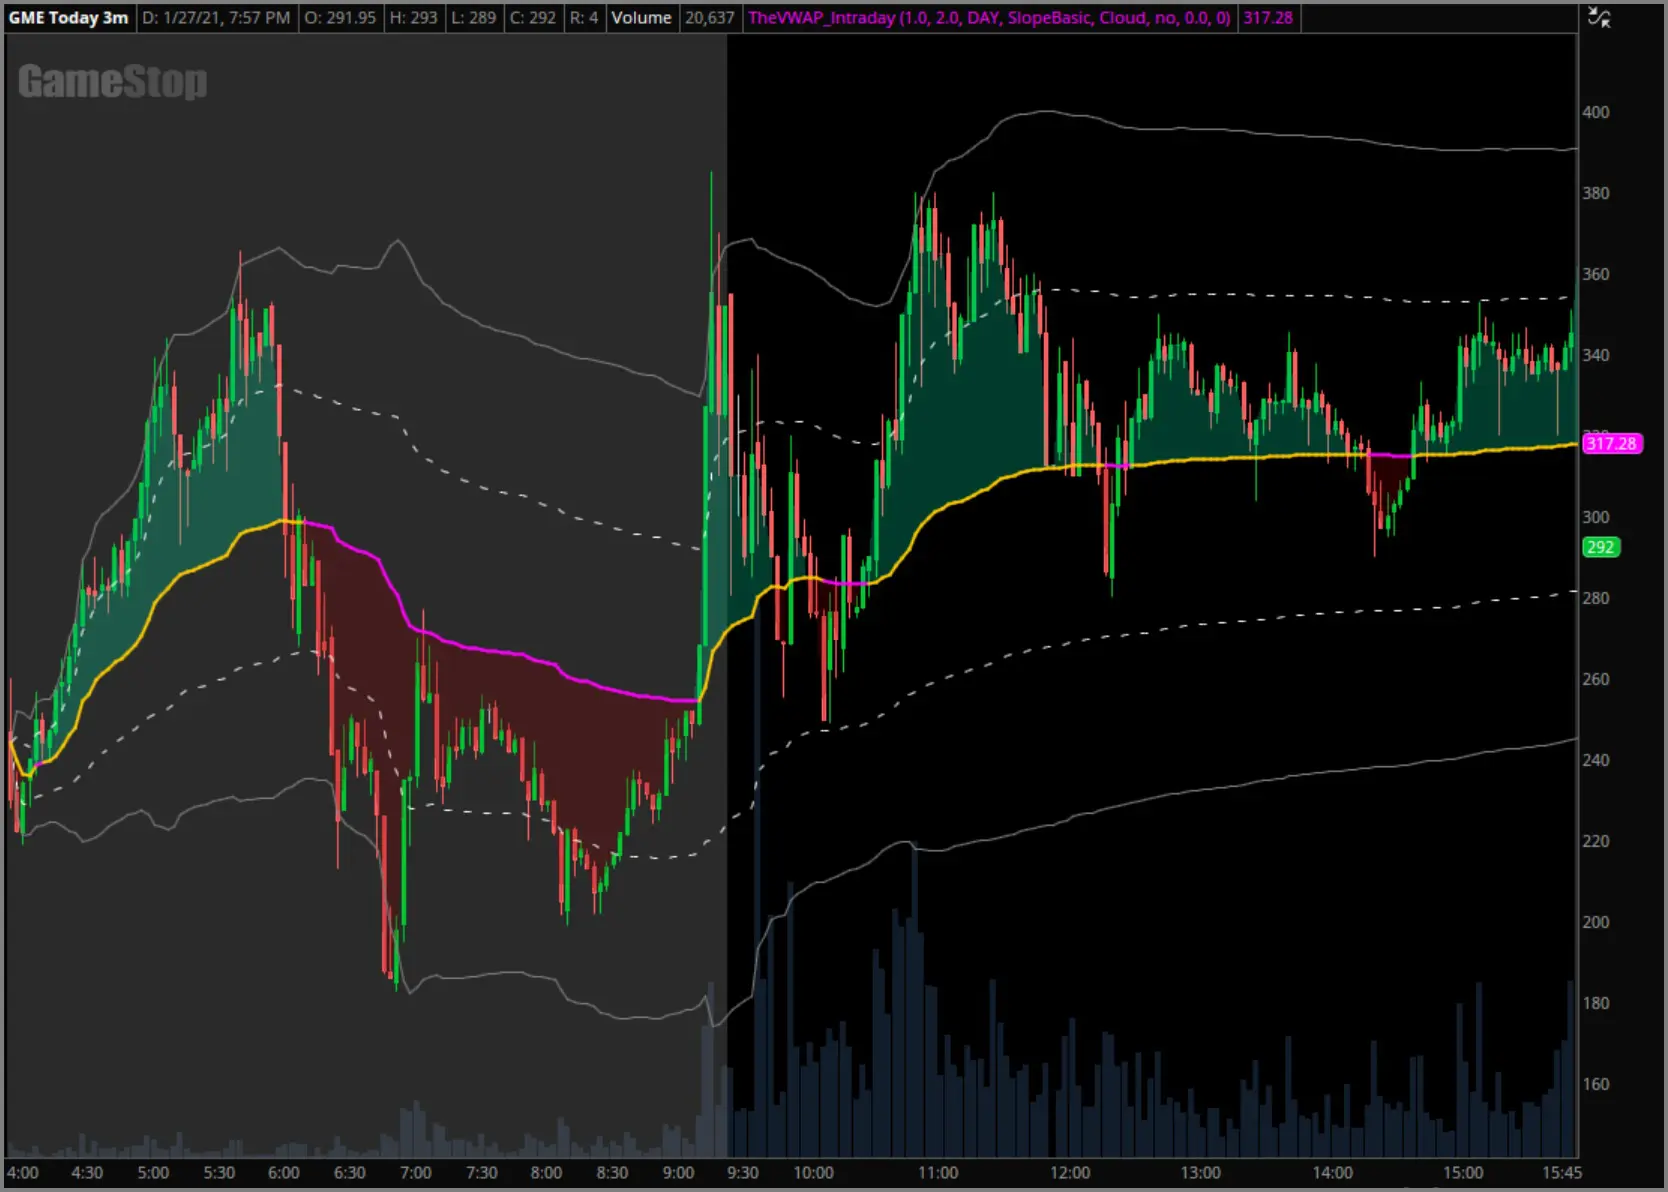
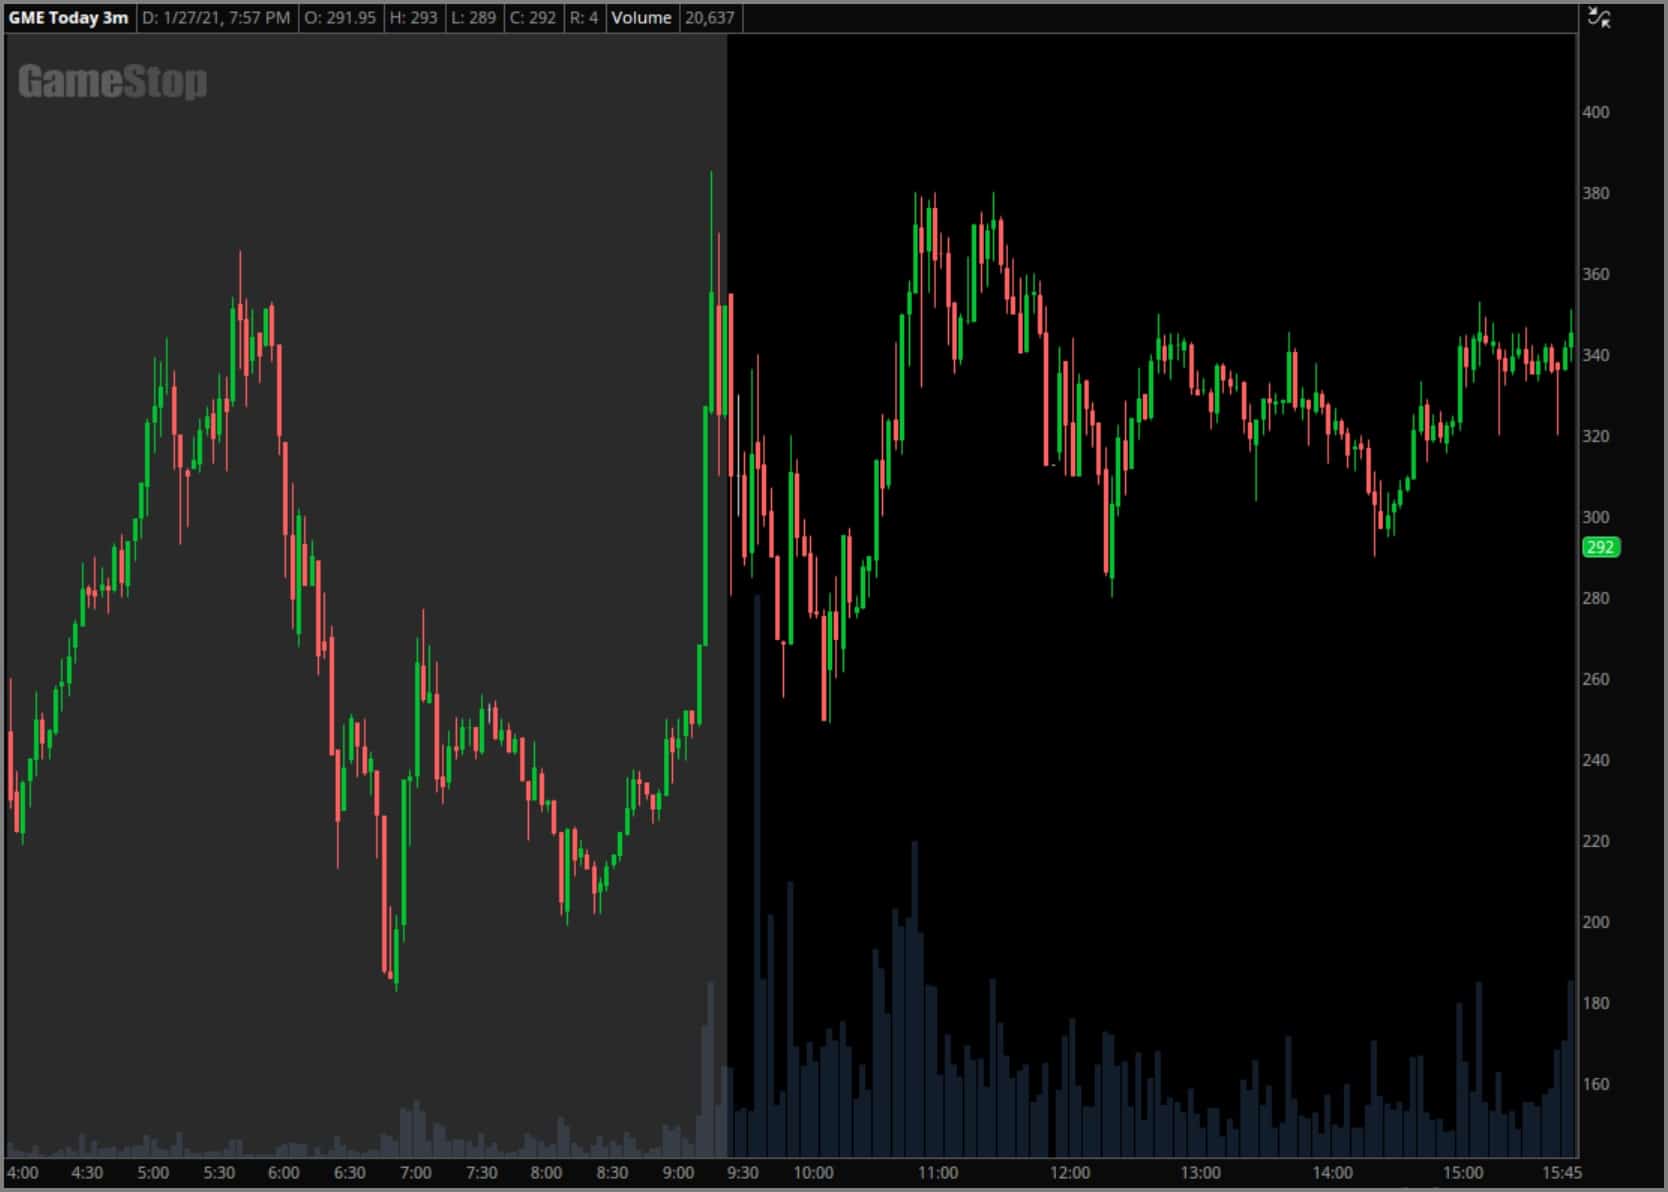
January 27, 2021
Pre-market trading on the 27th opened near the prior day’s post-market highs, but it didn’t
stay there for long. Over the next three hours GME squeezed to 365.42, snapped back down to
182.55, and then ramped again to 385. But despite the chaotic movement, intraday VWAP and its
deviations bands helped provide dynamic support and resistance on multiple occasions.
The same chaos continued into regular trading hours and the entire day was largely choppy and difficult to
read, but VWAP still continued to provide some sense of order.
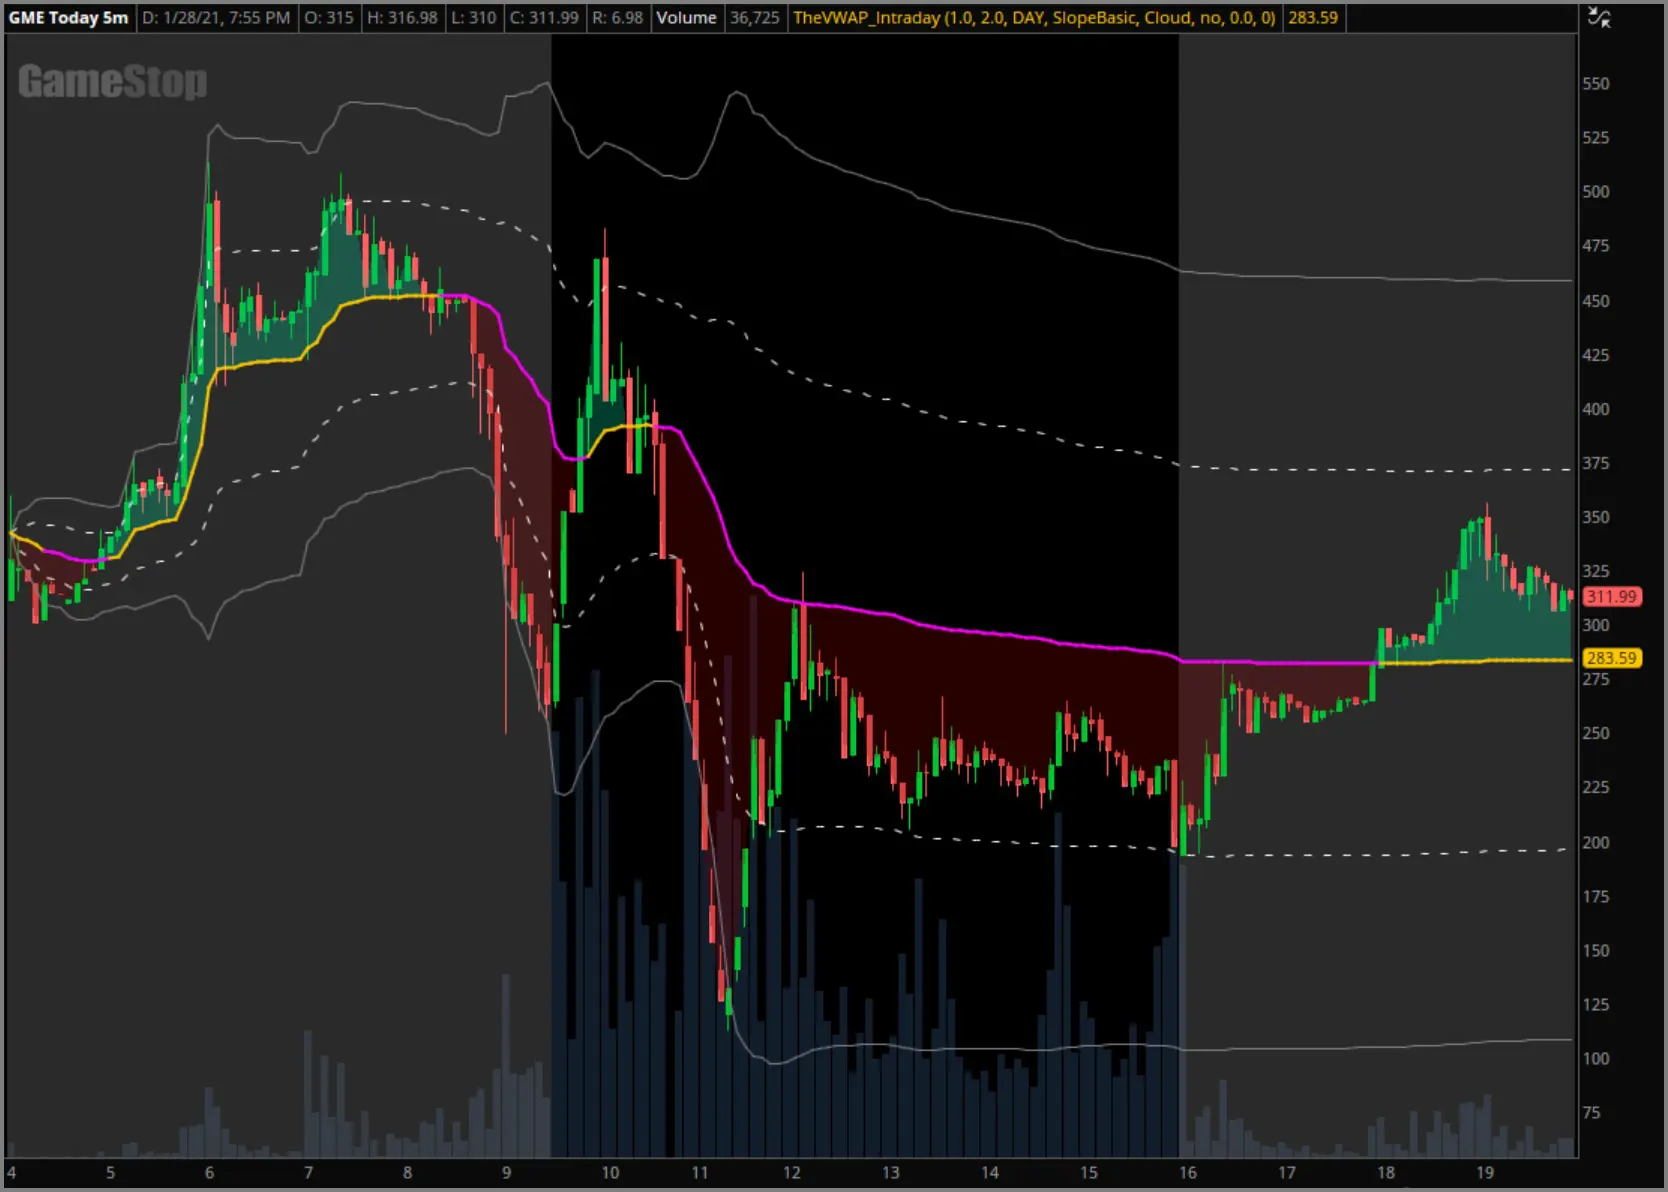
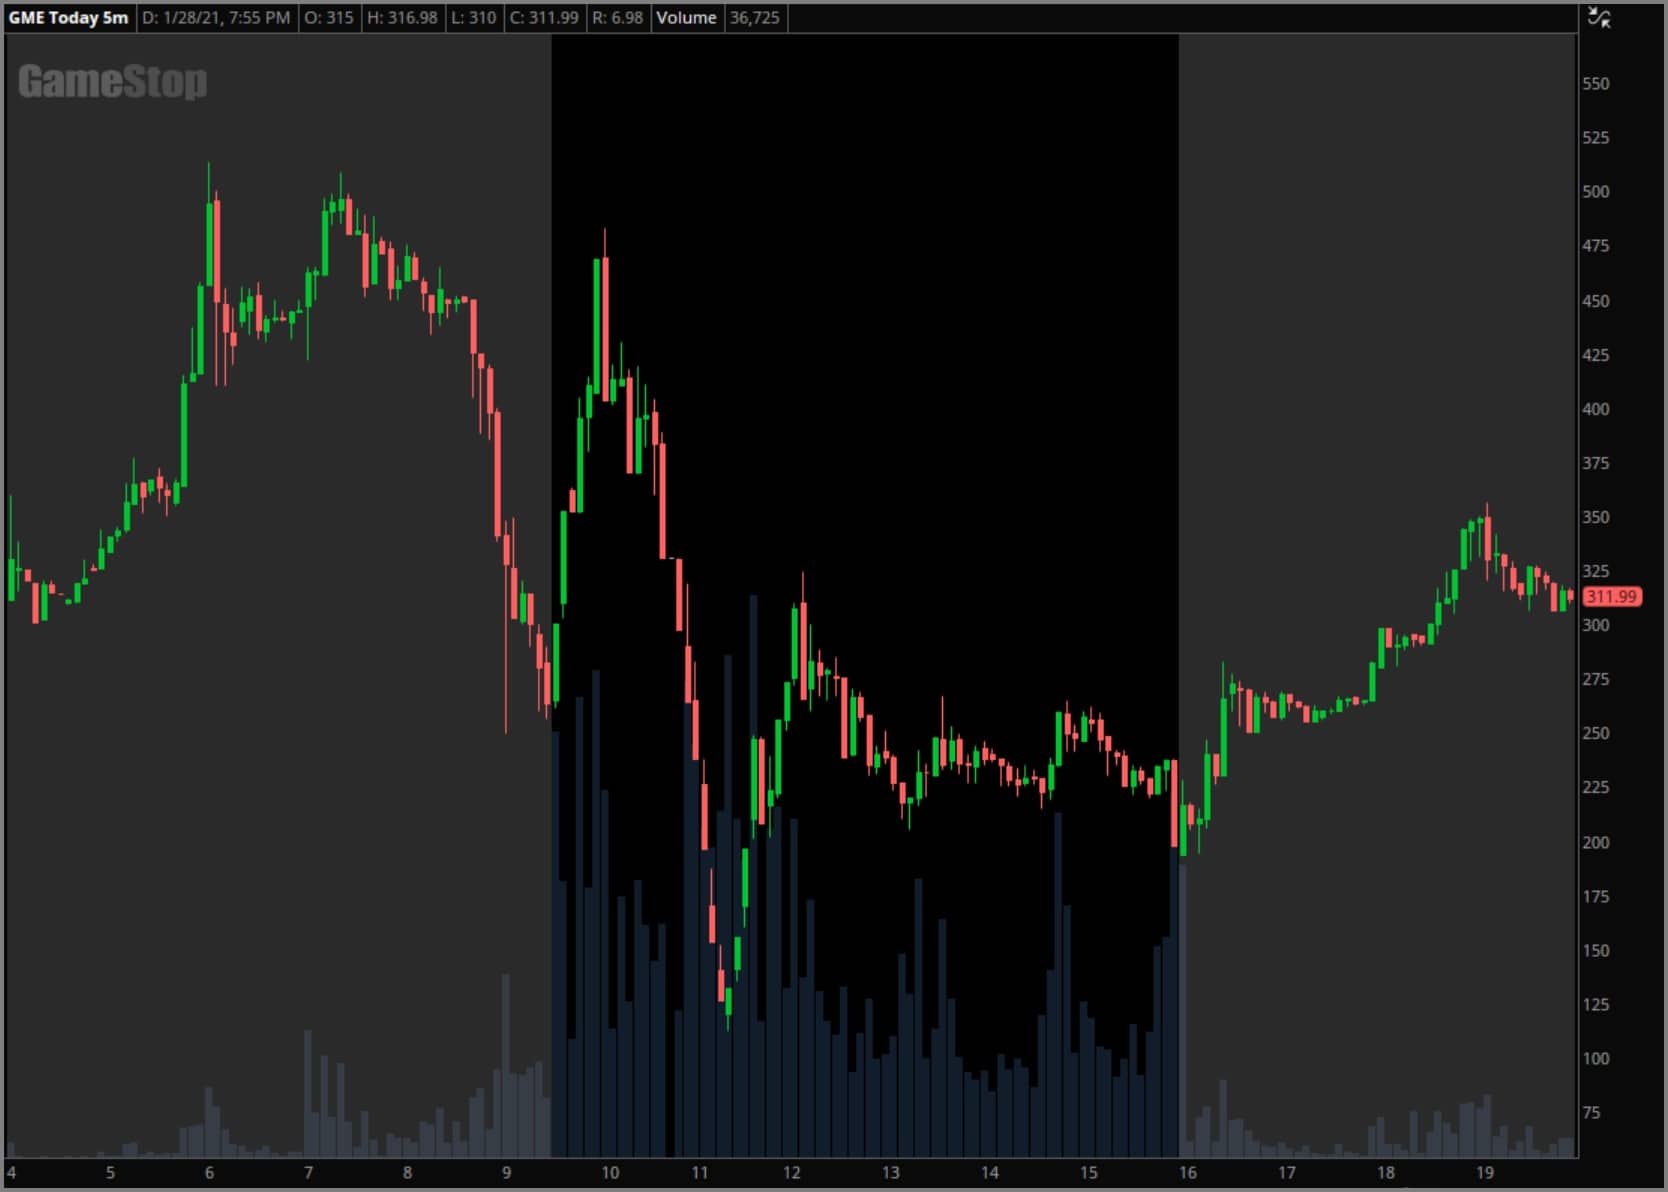
January 28, 2021
January 28th provided the highest peaks that GME would reach during this run, with a pre-market high of
508.83 and an intraday high of 483. This day also provided the most rapid freefall during the saga, with
price dropping all the way to 112.25 less than 90 minutes after achieving that intraday high.
But from 11:40am ET onwards, intraday VWAP and the standard deviation bands stepped in to provide a heavy
influence on the day’s price action that continued into post-market trading.
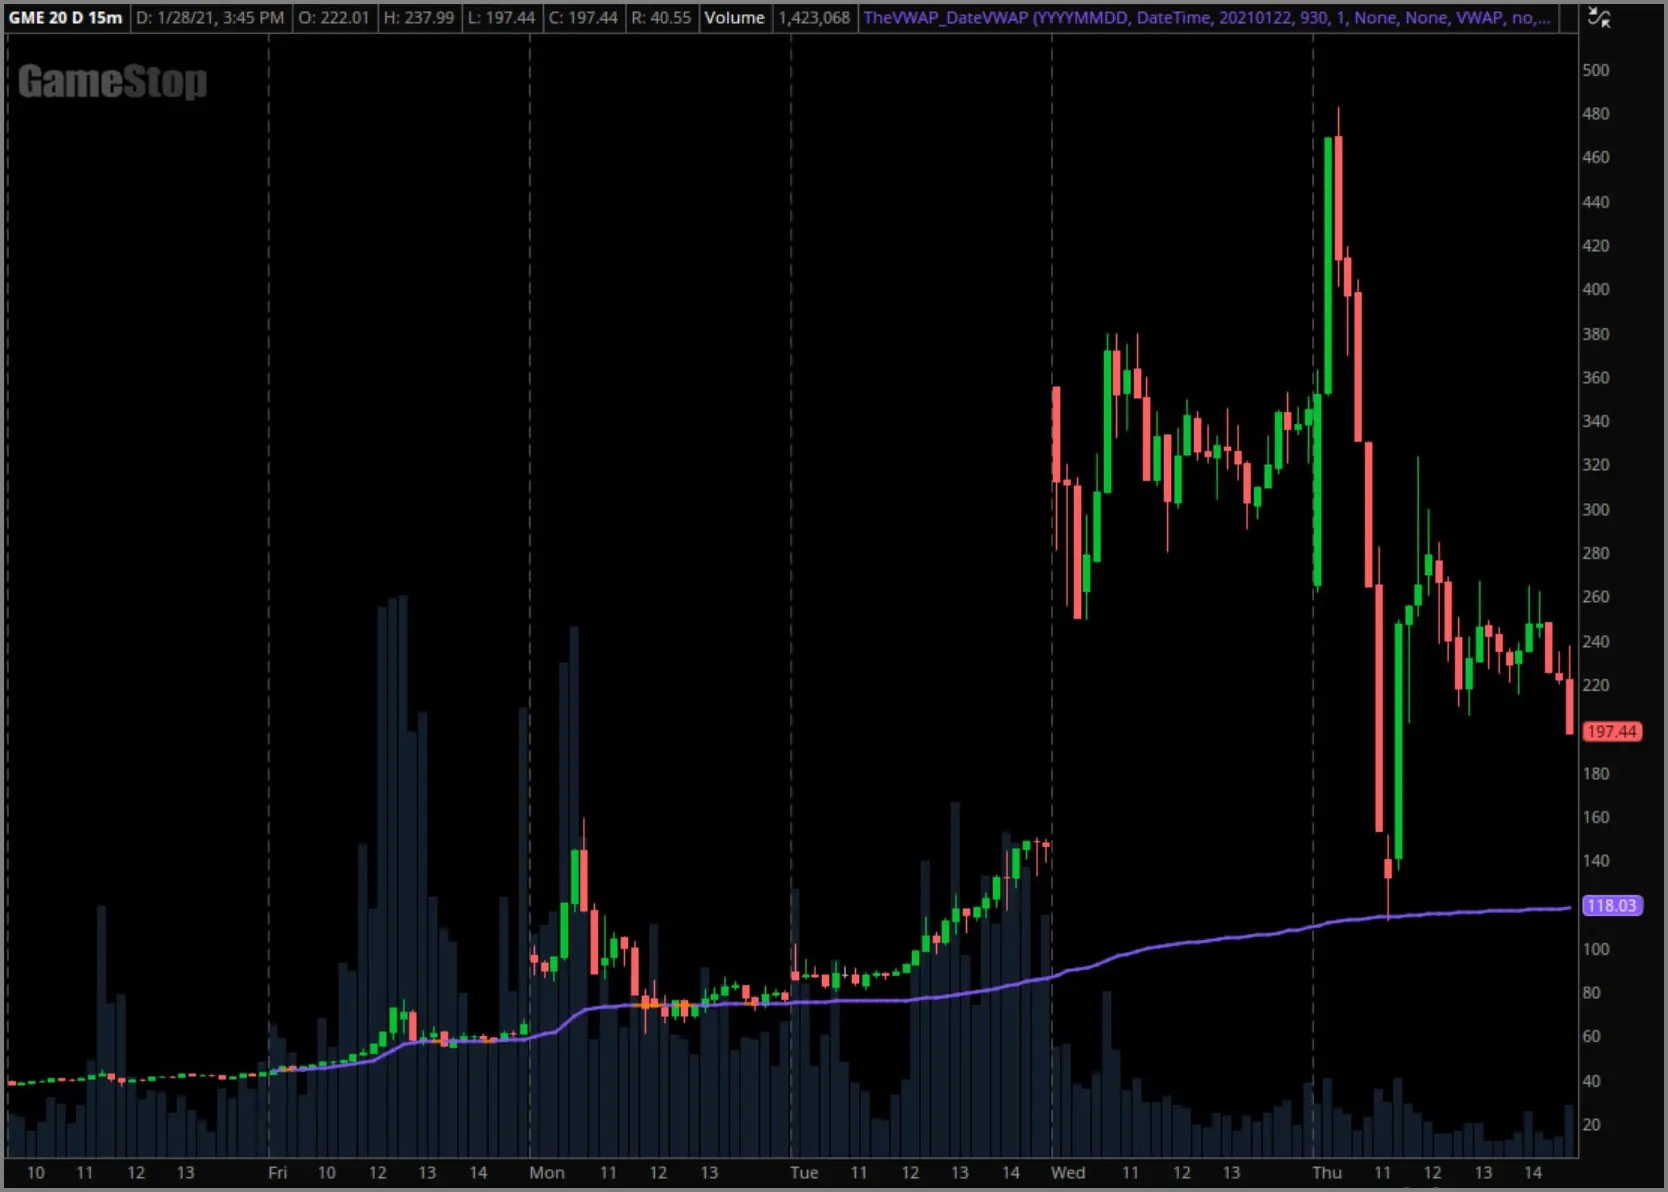
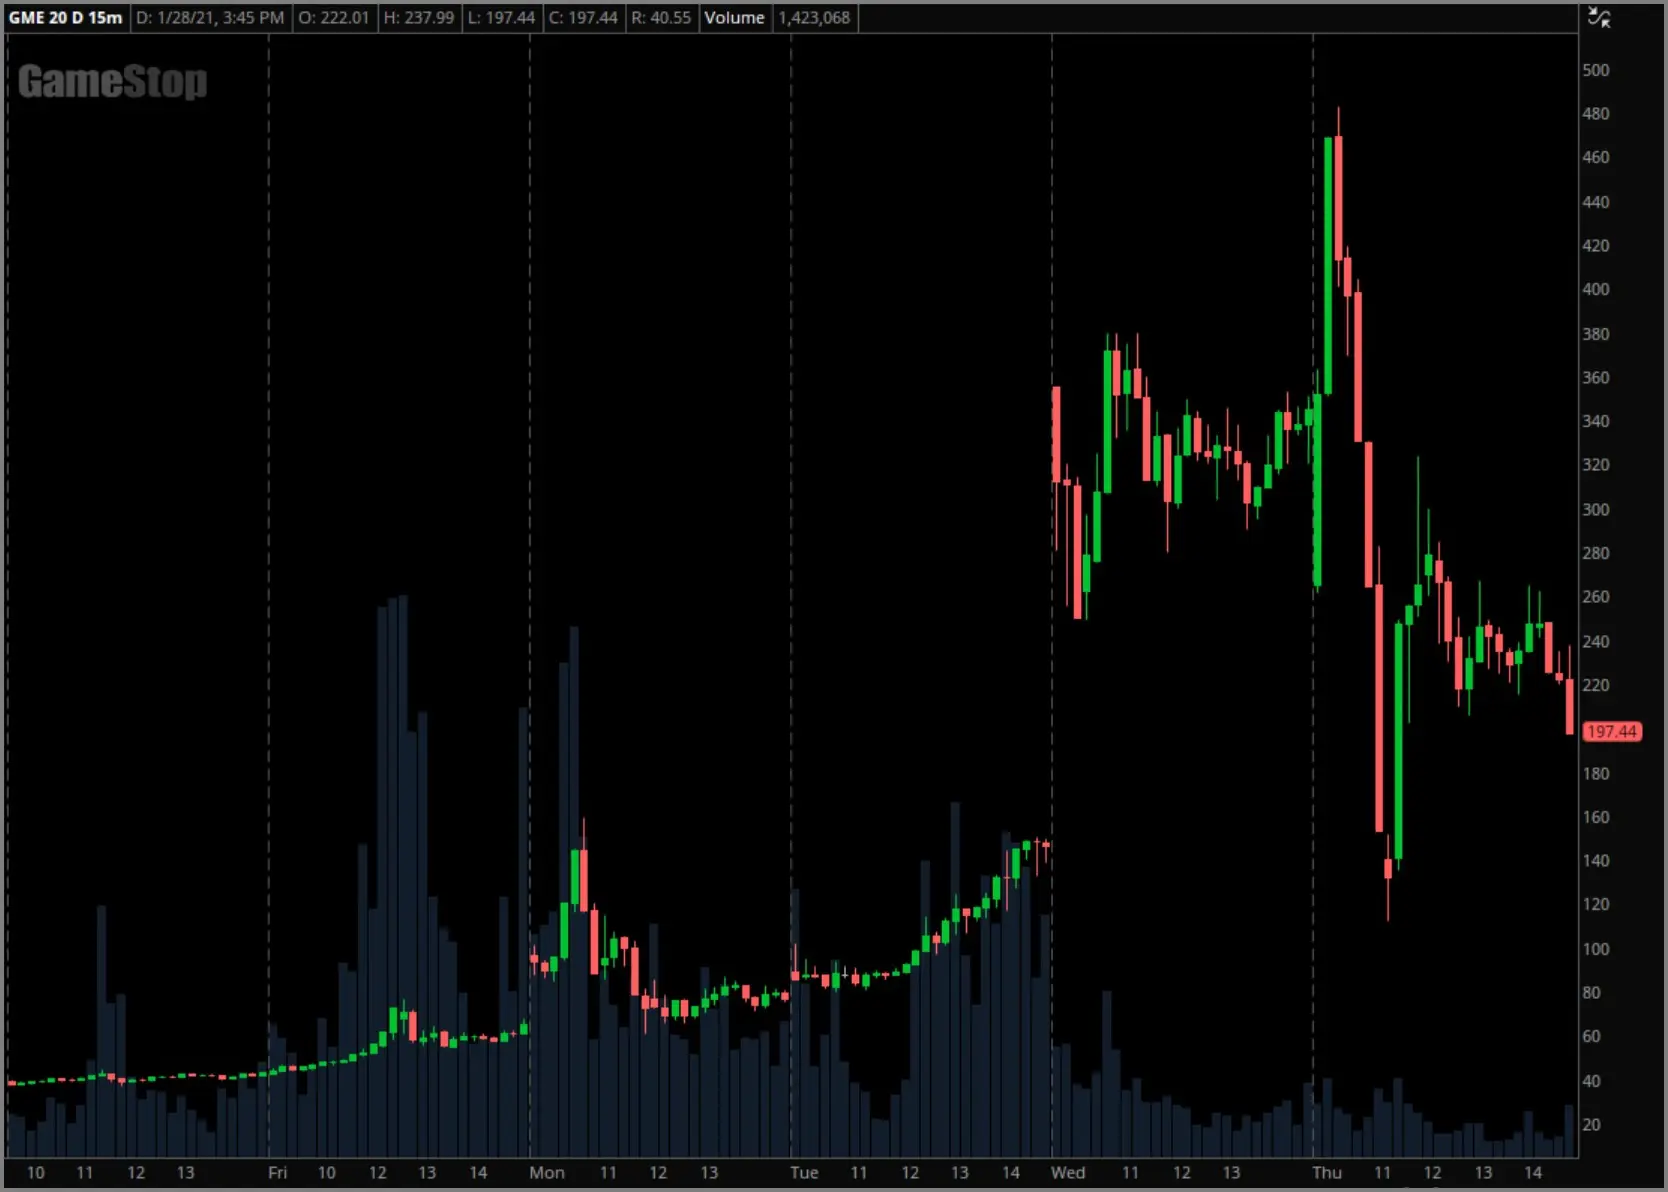
January 22nd — January 28th
The massive freefall that occurred on the 28th did eventually find an area of support, and that support was
a multiday VWAP anchored to January 22nd’s opening candle.
Part of our strategy involves the identification and implementation of these meaningful anchor points, which
in this case was the origination of GME’s main short squeeze. The 22nd was the highest volume day of the
entire run and provided the initial breakout to new all-time highs, so we began tracking a VWAP from that
key event to monitor for any future pullbacks.
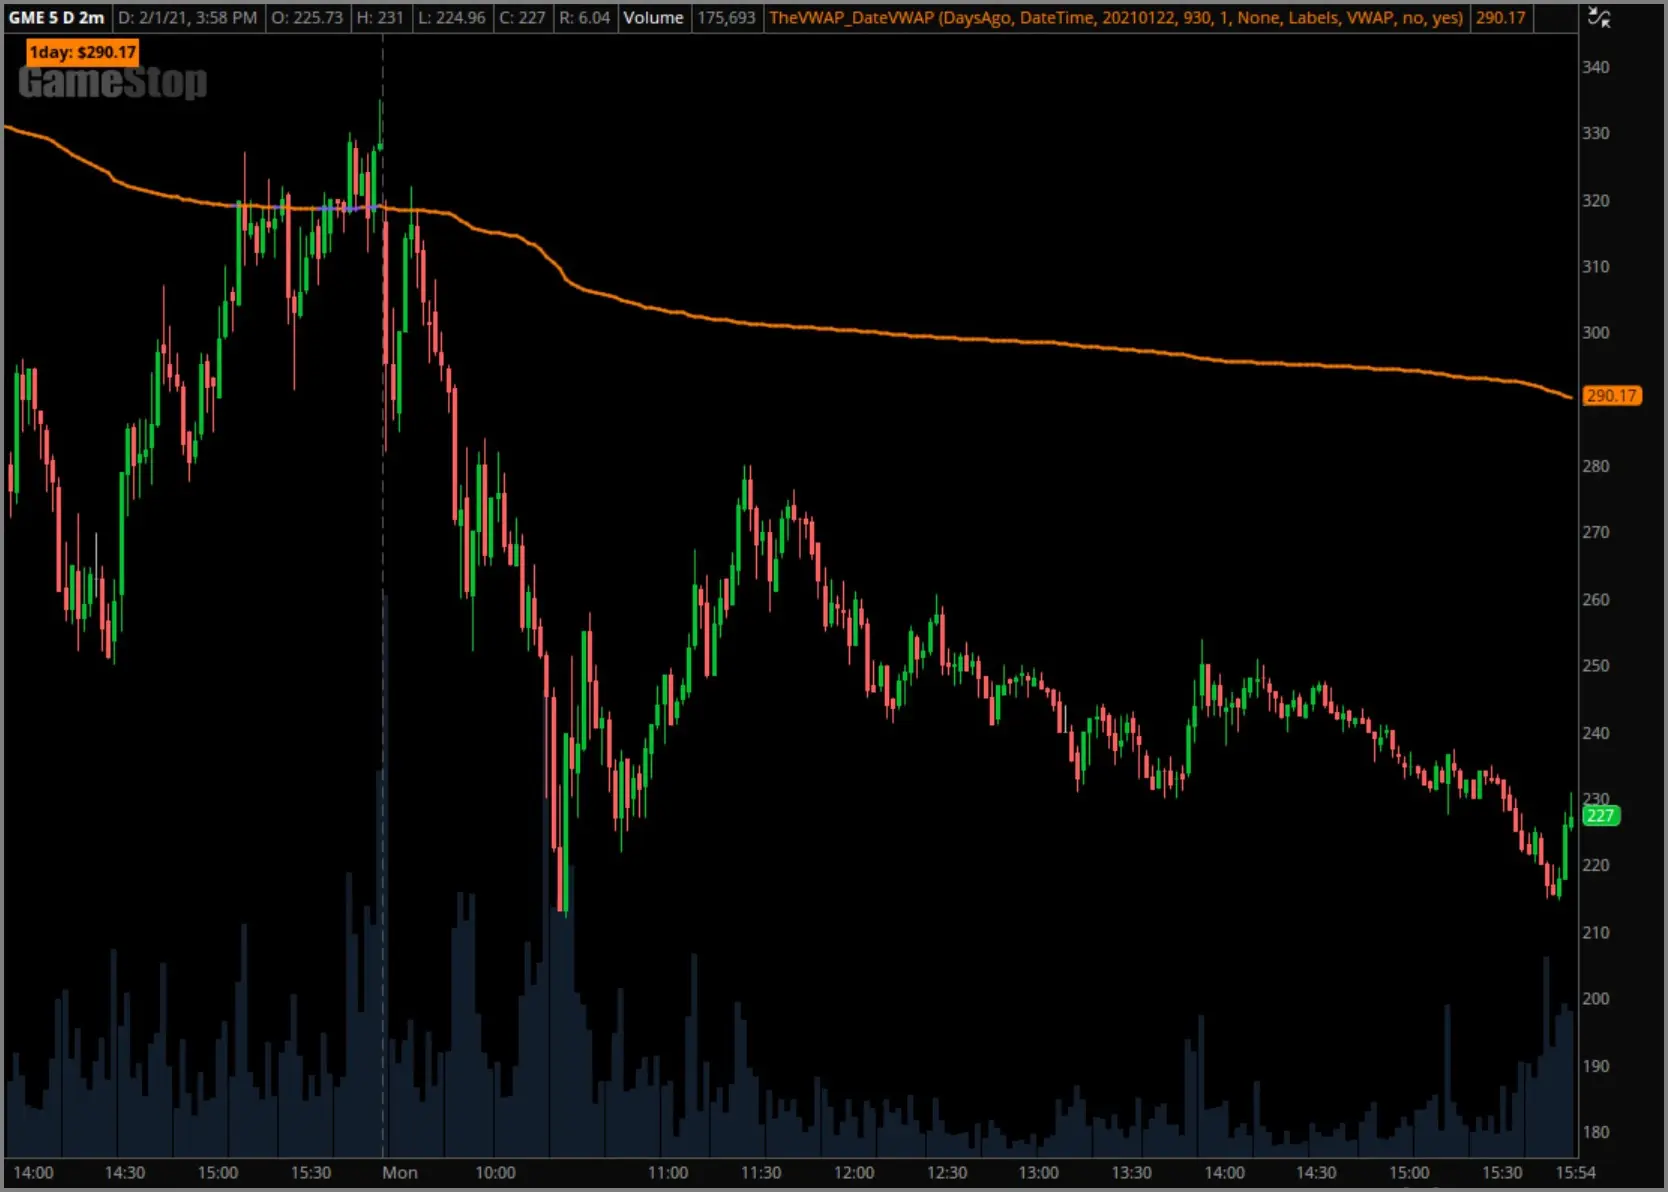
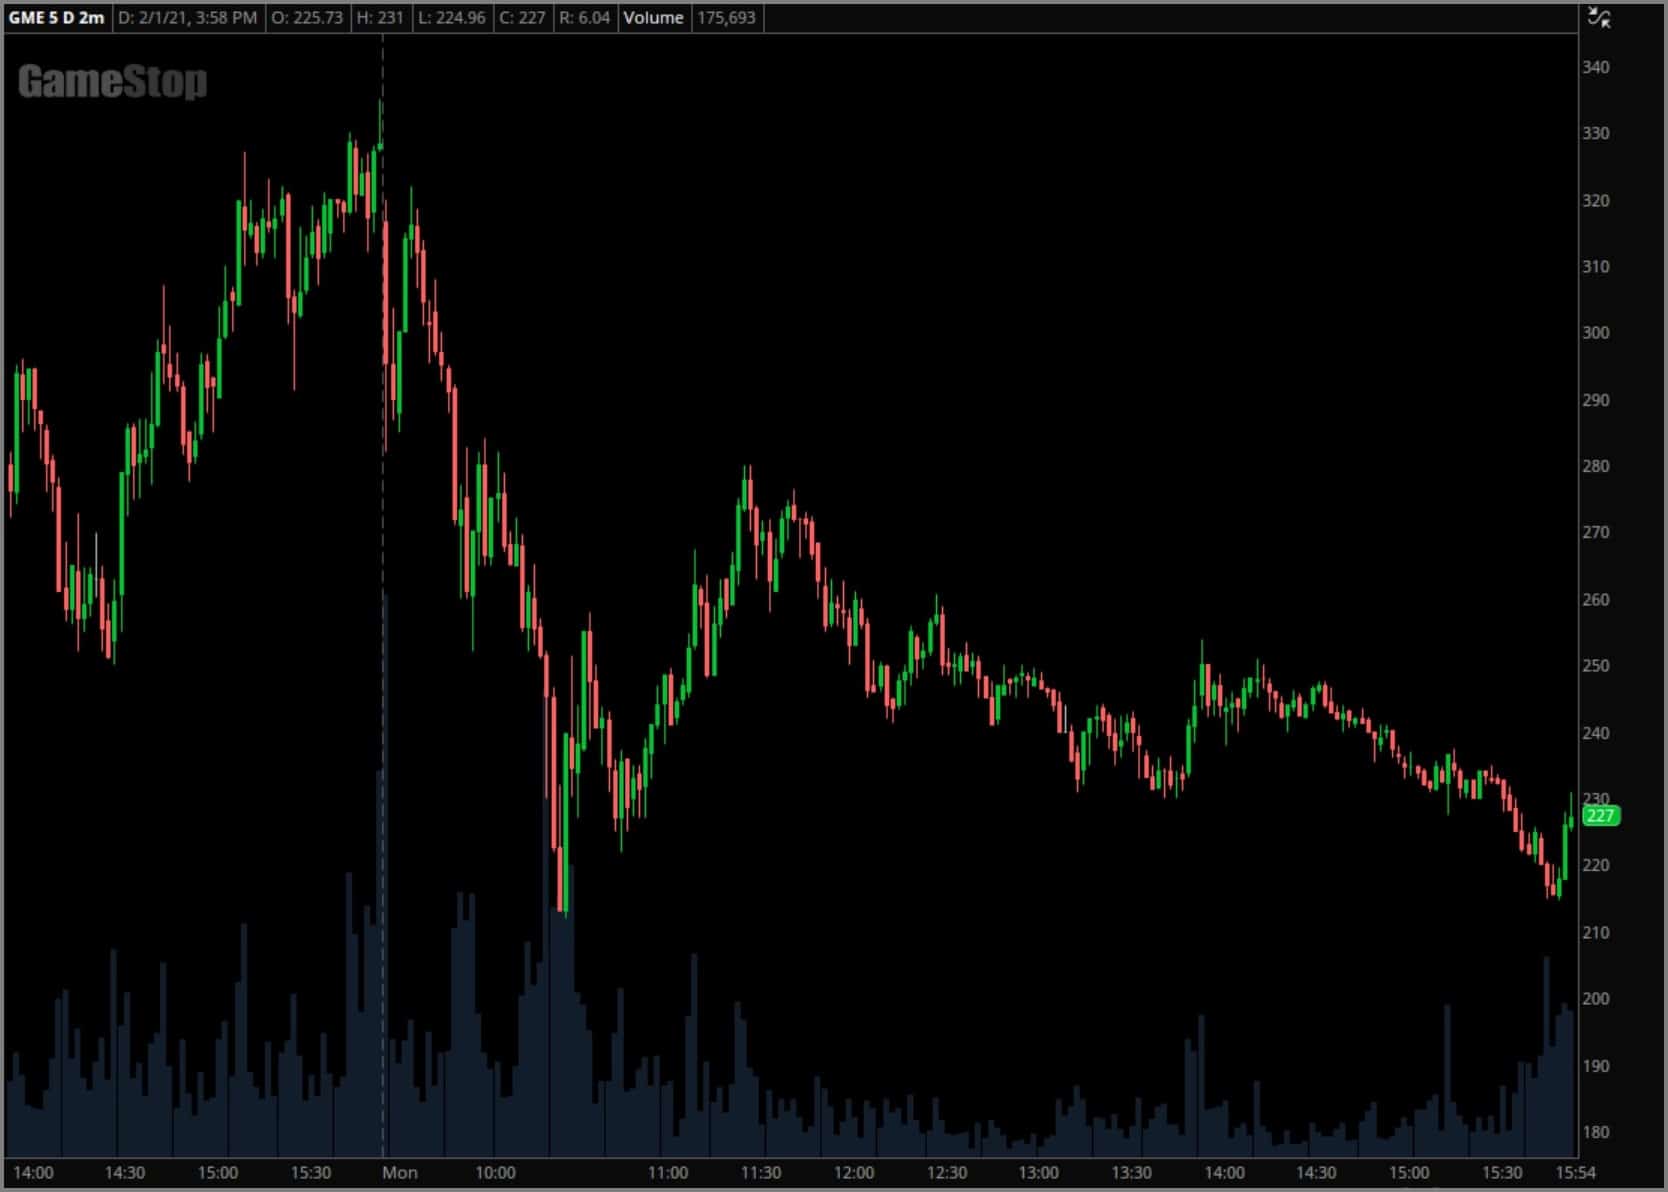
February 1, 2021
February 1st also underlined the importance of utilizing multiday VWAPs in addition to our intraday
approach, as GME retested the prior day’s VWAP twice in the opening ten minutes. Both of those tests failed,
and price proceeded to drop over 100 points in less than an hour afterwards.
Regular trading closed at 227 and continued to fade to a low of 173 that night as the daily volume continued
to drop for the third straight day.
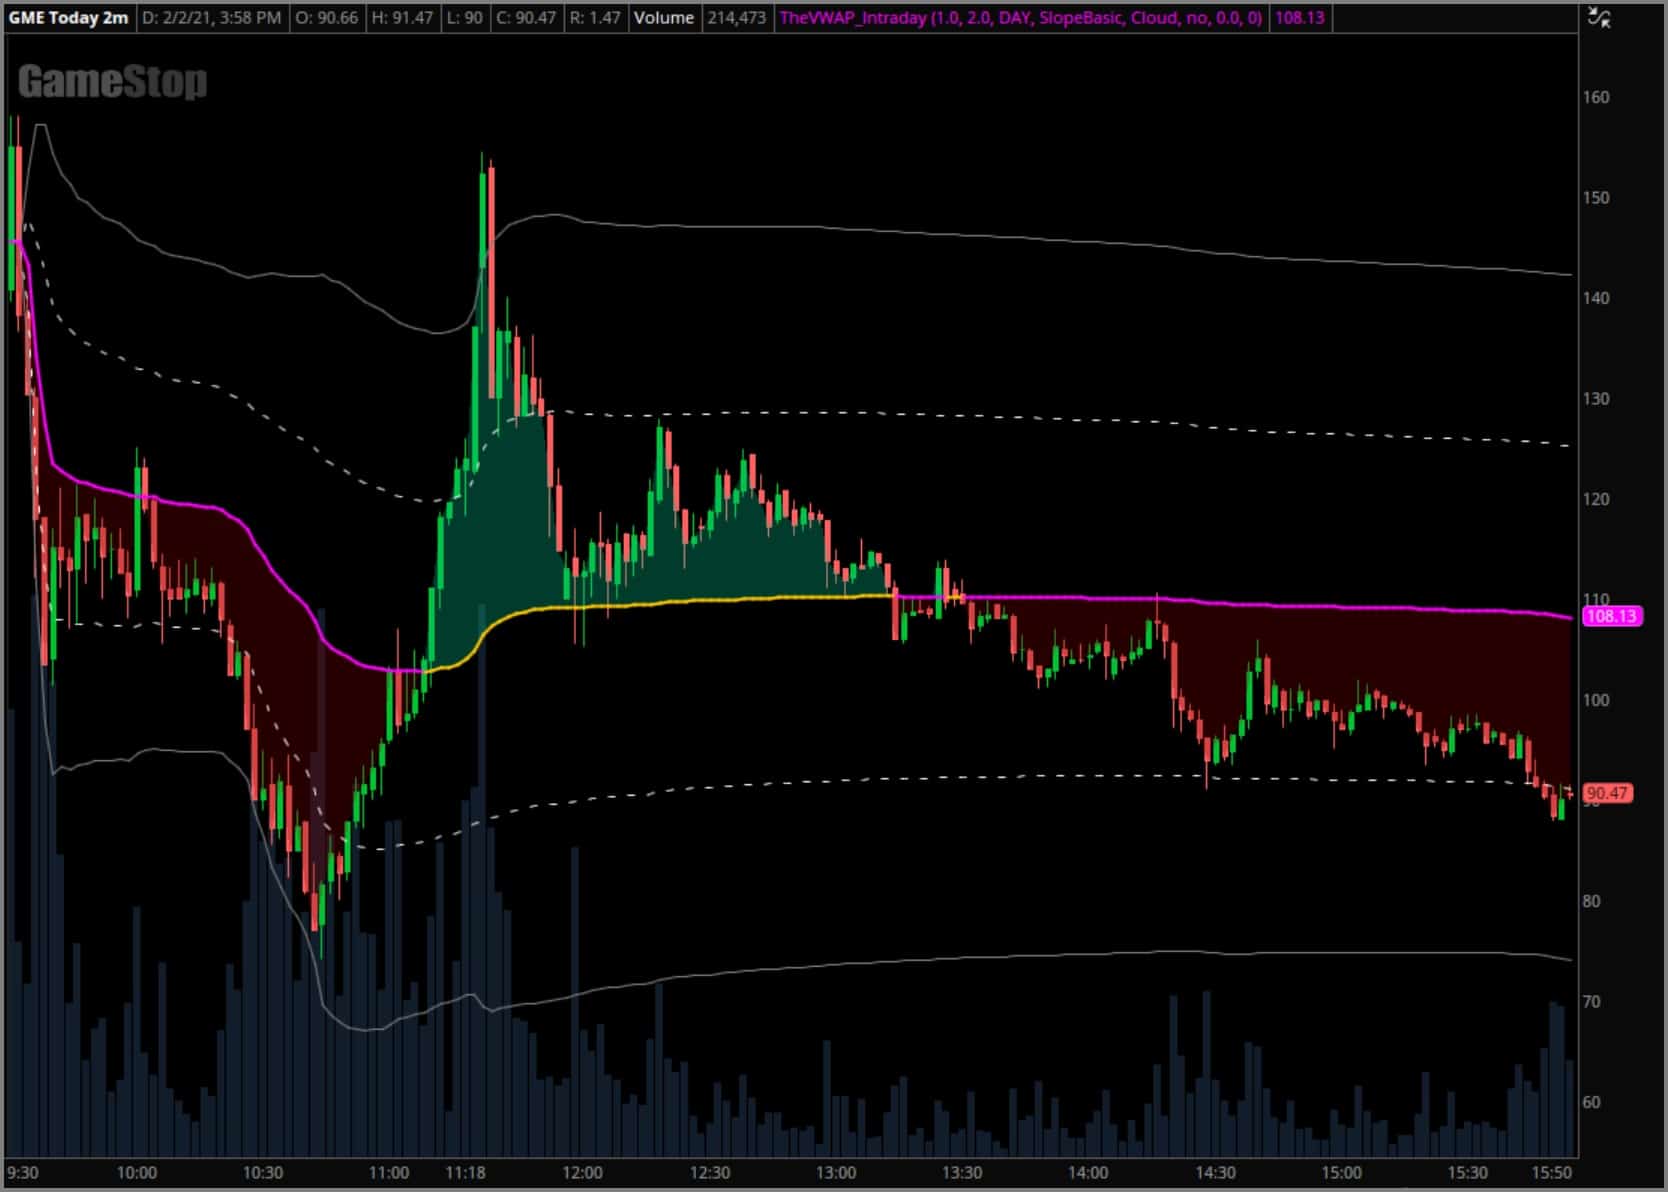
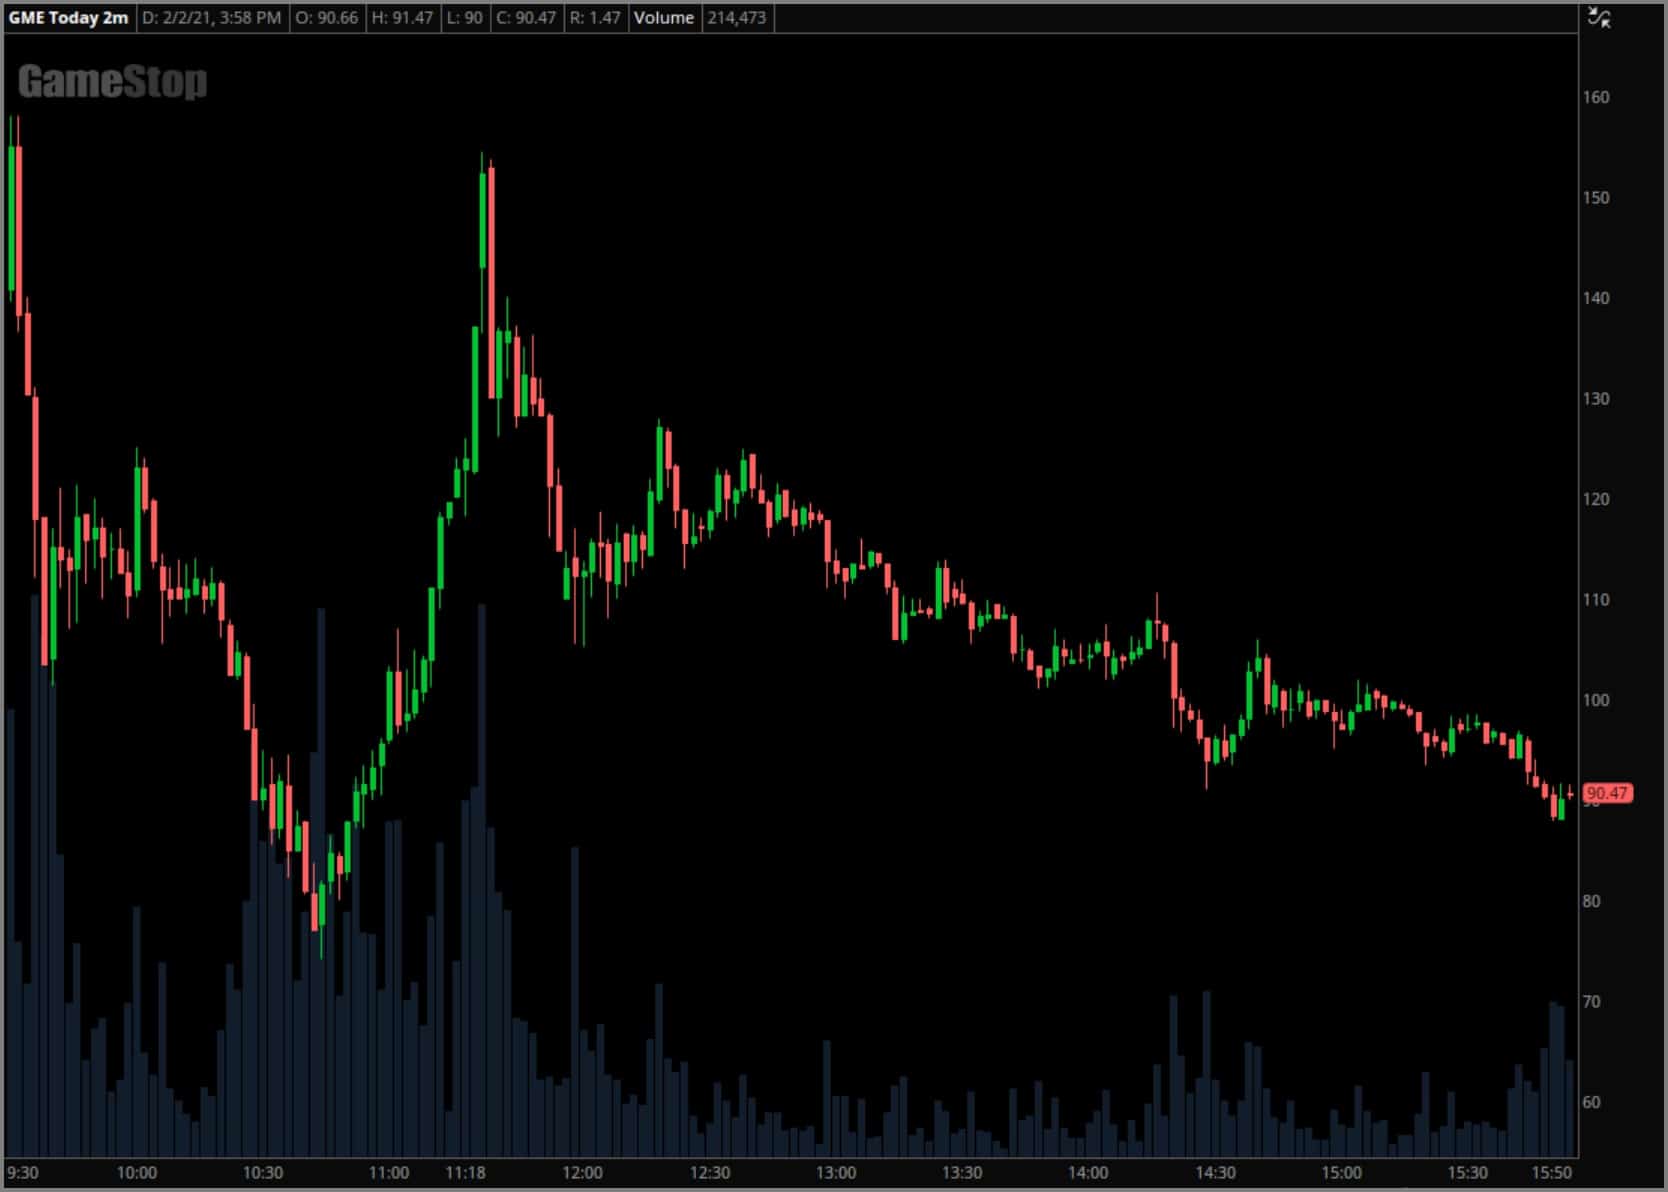
February 2, 2021
This was one of the last notable days of this initial run, and once again VWAP continued to exert its
influence. GME provided one last-gasp surge around 11:30 and the +1 deviation band attempted to provide some
dynamic support, but selling pressure forced it back to intraday VWAP and that temporary support later
became resistance.
Price faded slowly over the remaining hours, and in the following days GME continued to decline… until
February 24th.
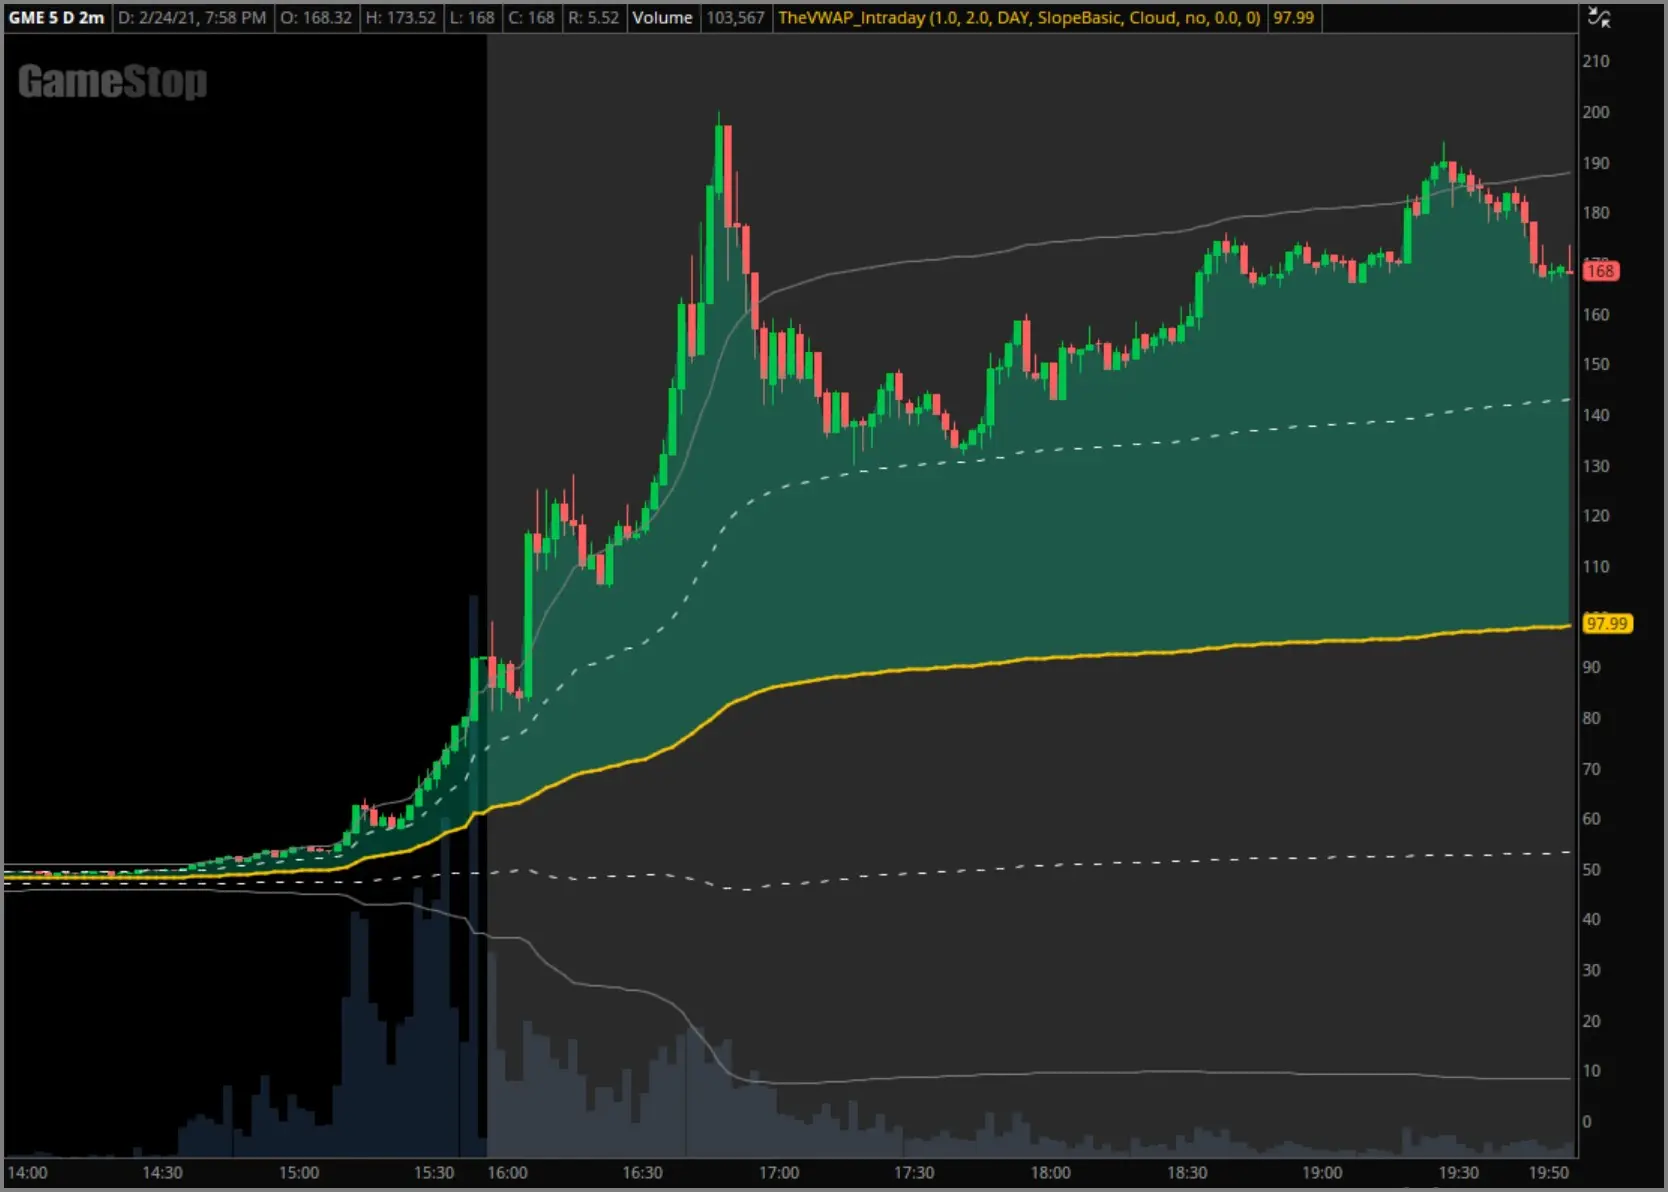
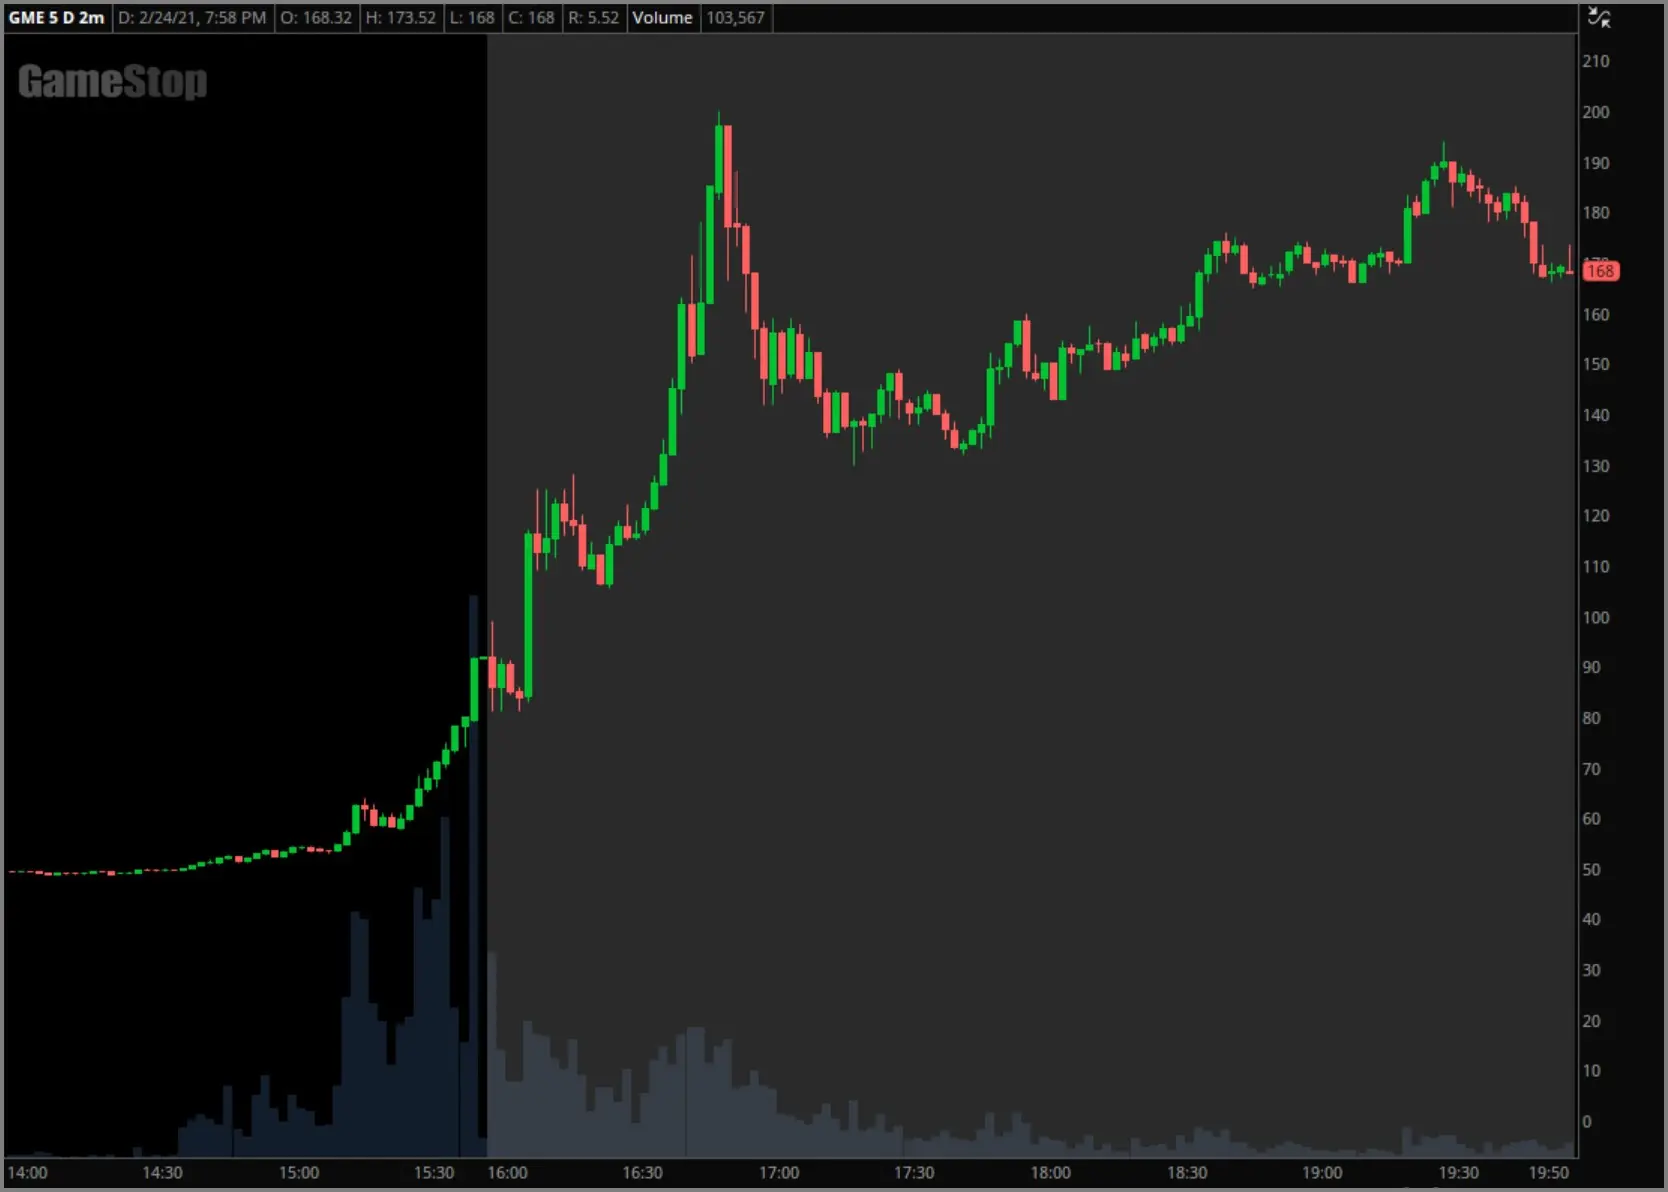
February 24, 2021
This timeline is meant to show the role of VWAP in GME’s initial rise and fall in late January, but as many
of you know it surged yet again from February 24th to March 10th and continues to trade in three-digit
territory as of this post. We wanted to showcase one day from that secondary run — the 24th — to highlight
the fact that VWAP has continued to play just as crucial of a role.
GME was oftentimes unpredictable and erratic during these runs, but with the proper framework and strategy
in place these types of price moves aren’t beyond understanding.
This timeline highlights the role of VWAP and the strategy we trade in the initial rise and fall of GameStop
that occurred between January 22nd and February 2nd, 2021.
The following charts showcases several core components of our approach — intraday VWAP, standard deviation bands, and longer-term anchored VWAPs.