VWAP Indicators for thinkorswim
View all of our custom thinkorswim indicators, including one available for free.
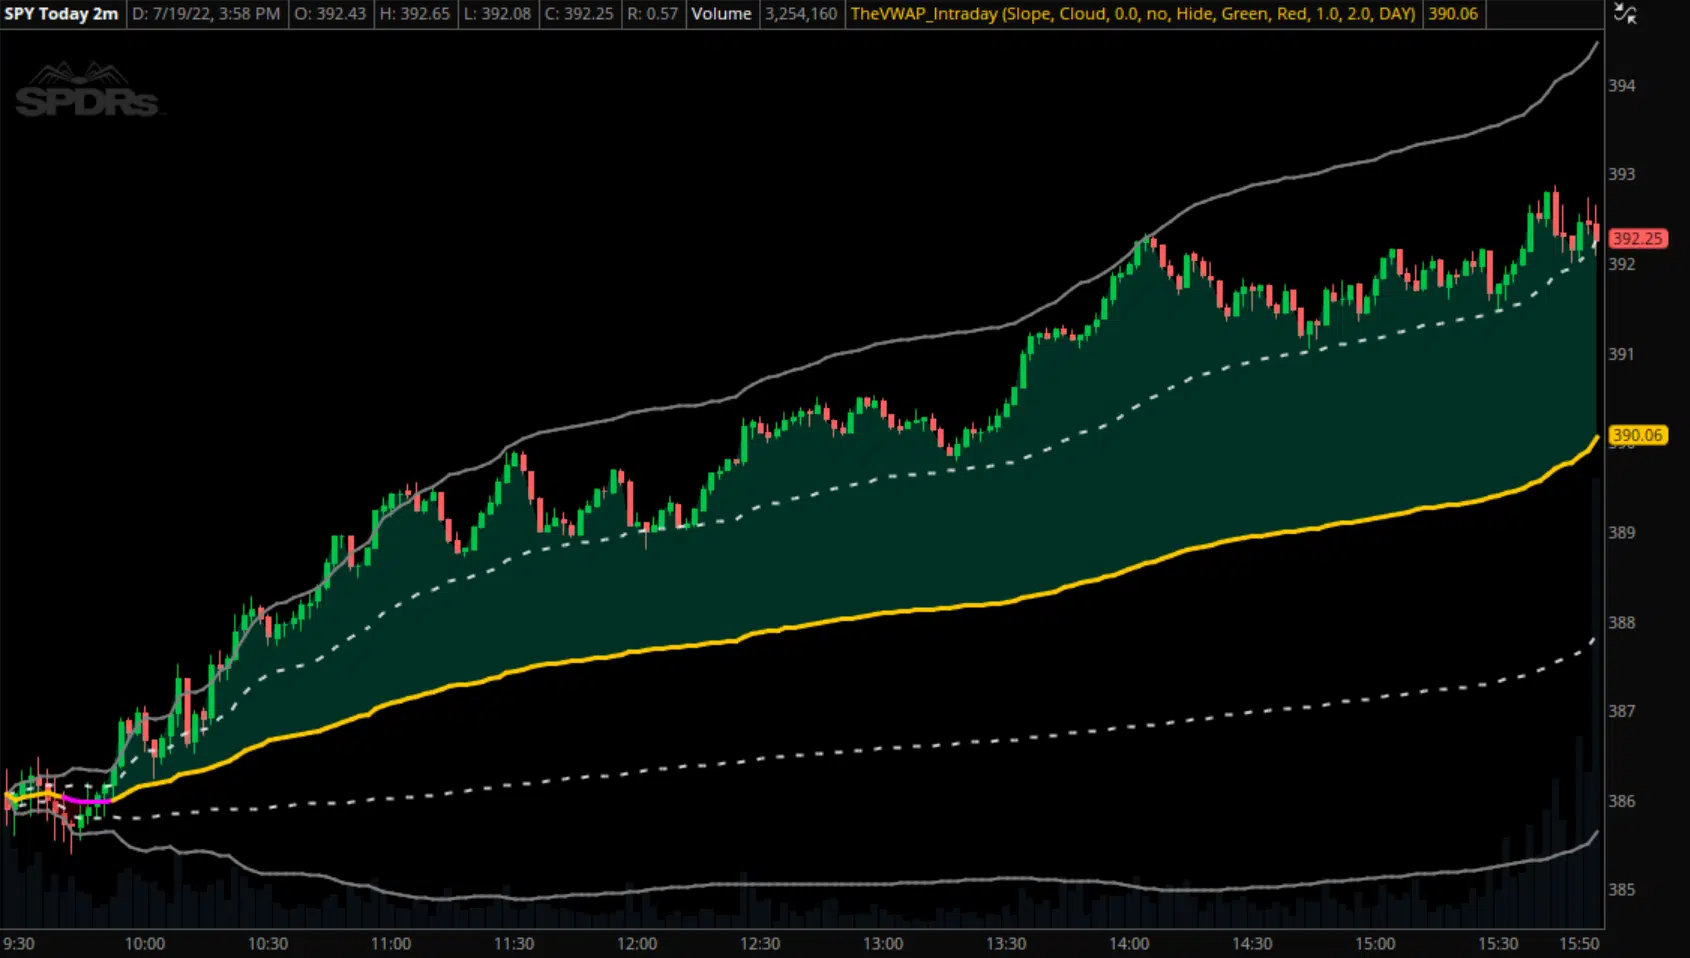
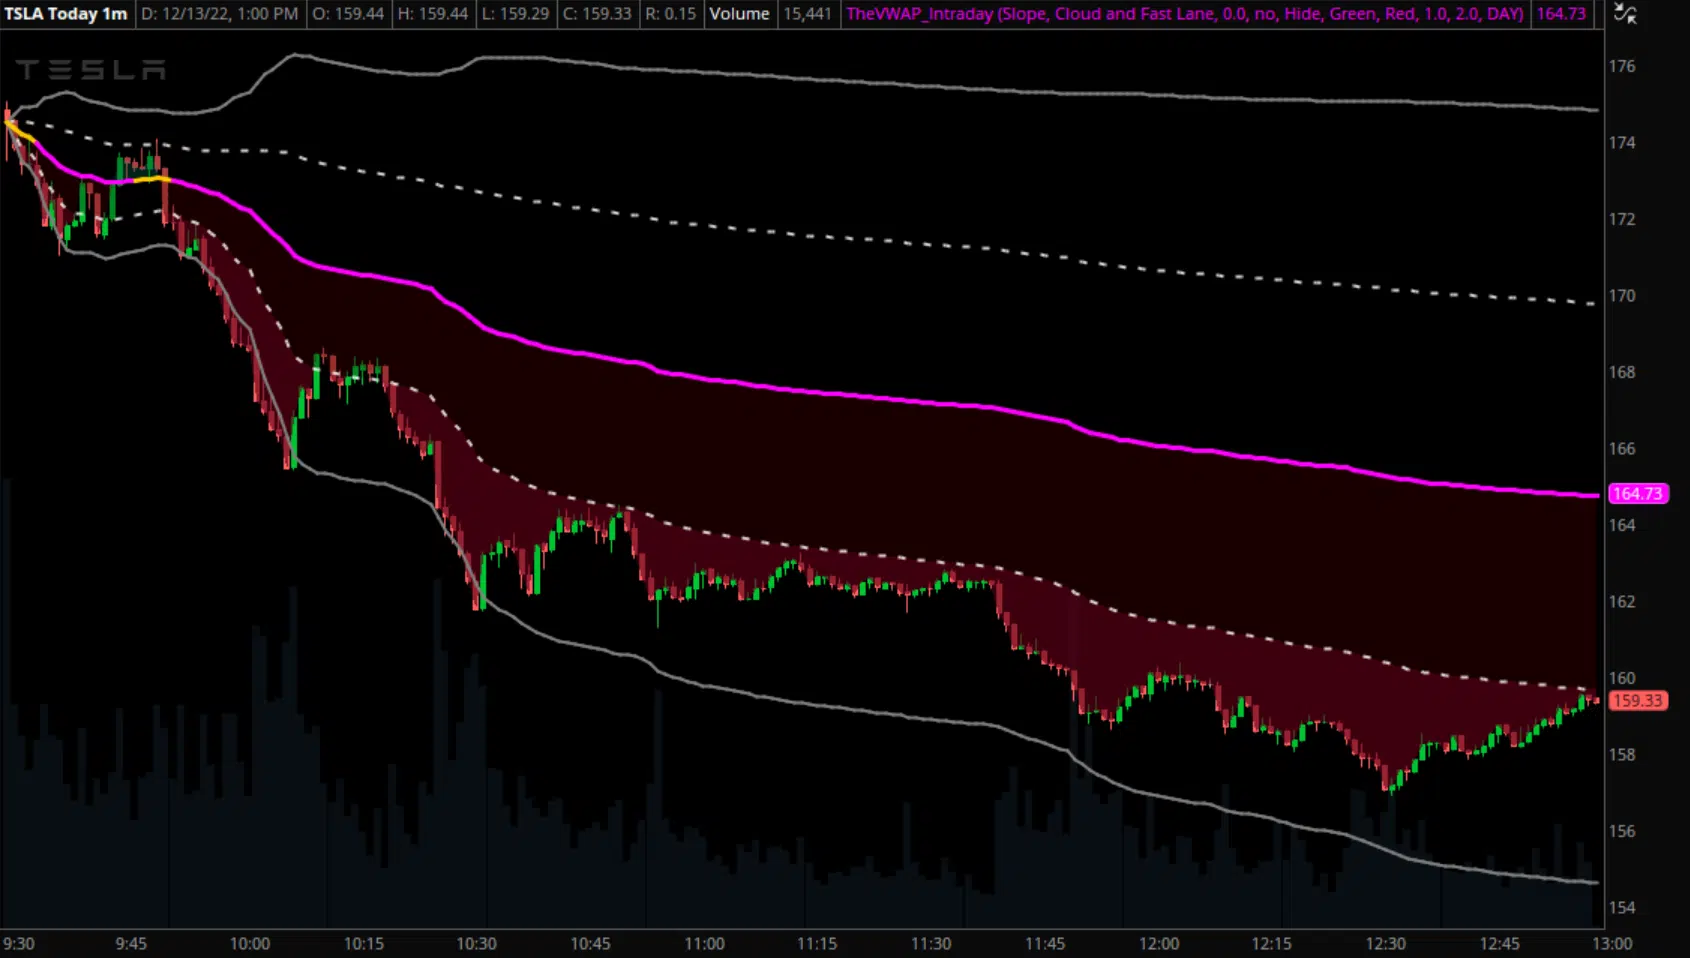
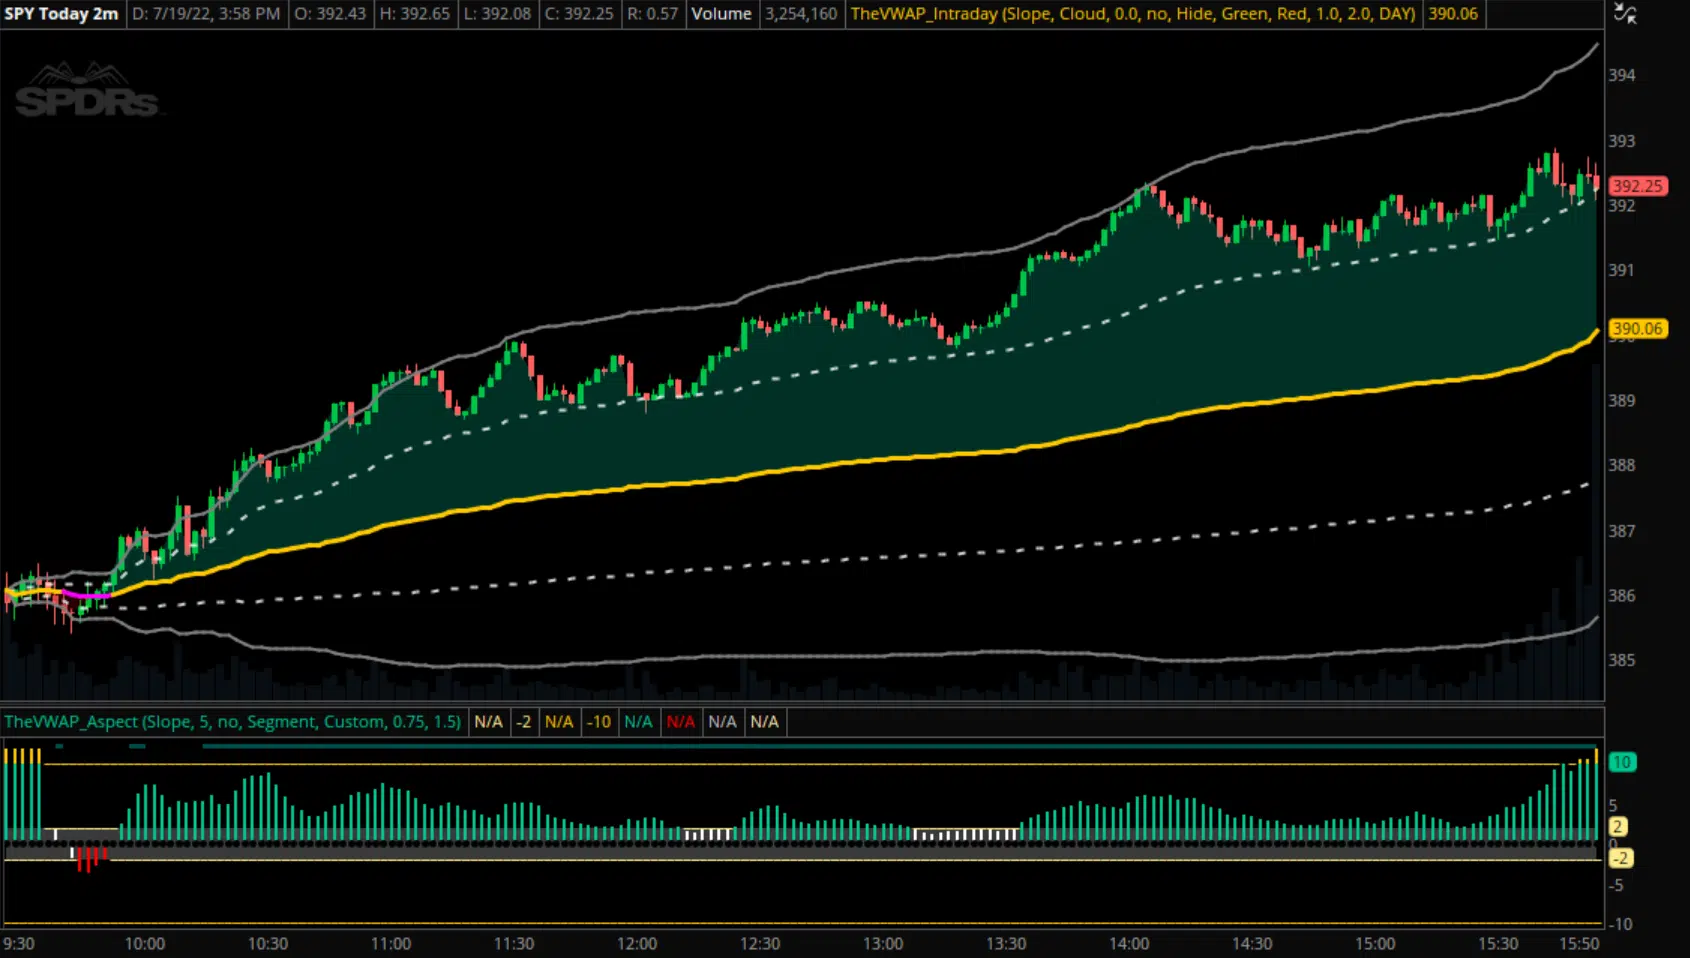
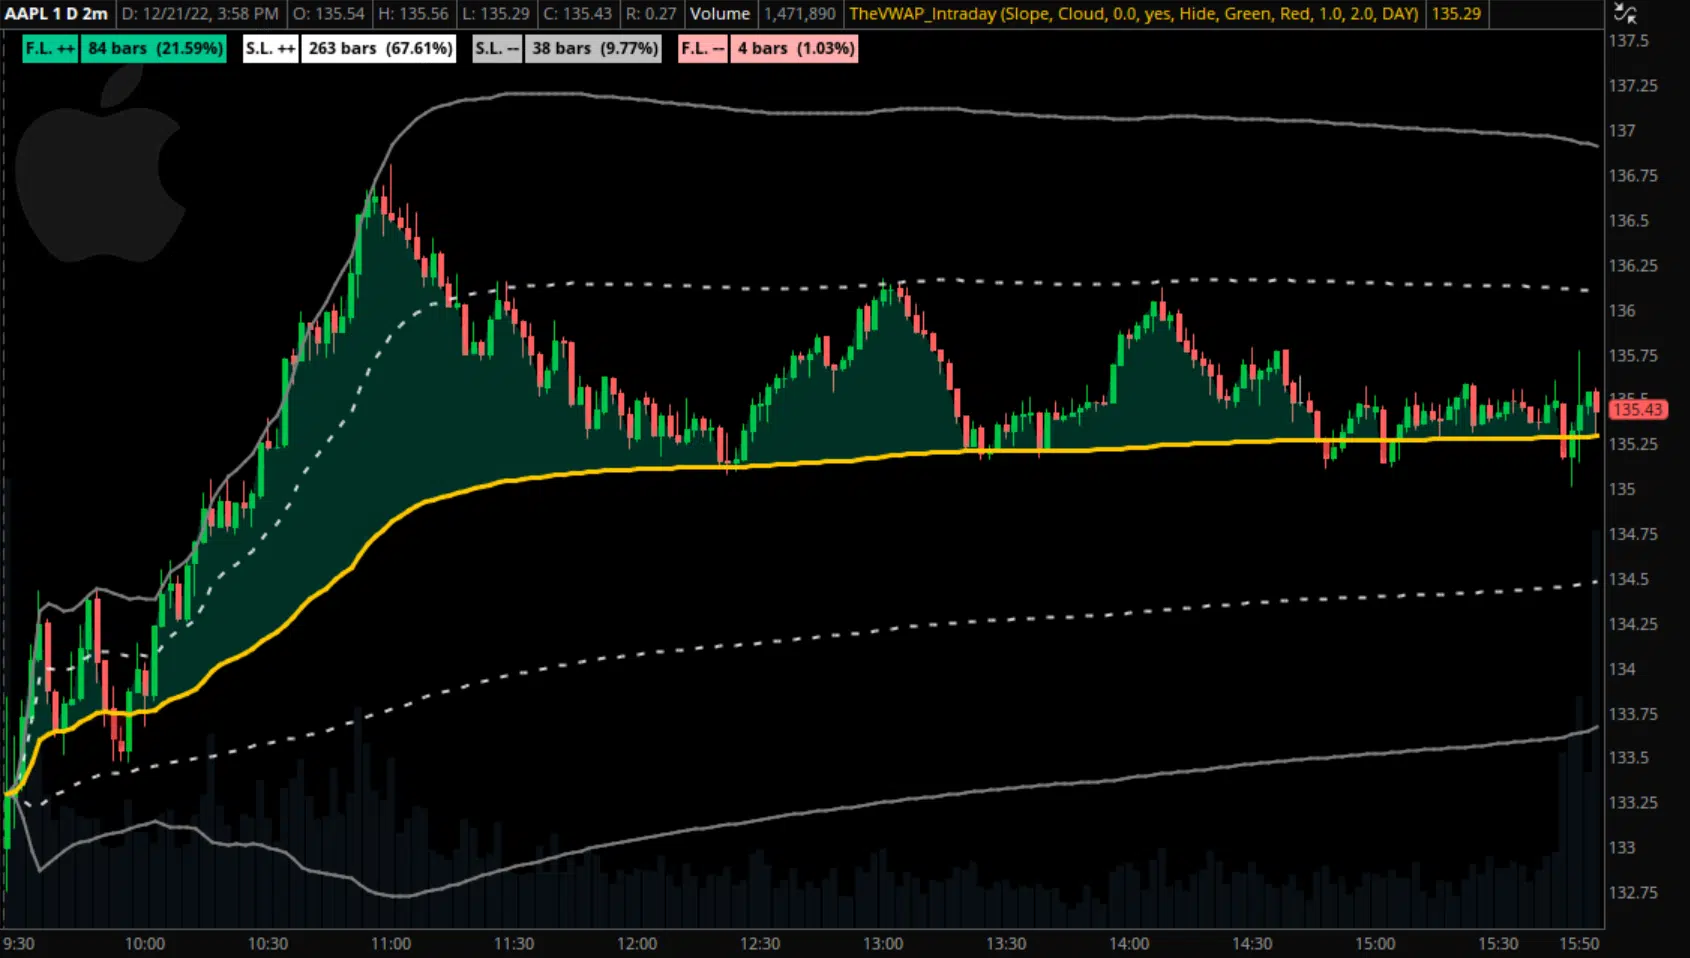
#1 — Intraday
Download our free intraday VWAP indicator for thinkorswim, which includes optional standard deviation
bands, an optimized user interface, and more.
Anchoring to the open of each market day by default, this indicator serves as an essential visual
reference point and is a core part of our framework for intraday trading.
Core features:
Multiple standard deviation band inputs
Dynamic color-coding for plots and clouds
Day, Week, or Month presets for VWAP length
Adjustable tolerance bands for zone buffers
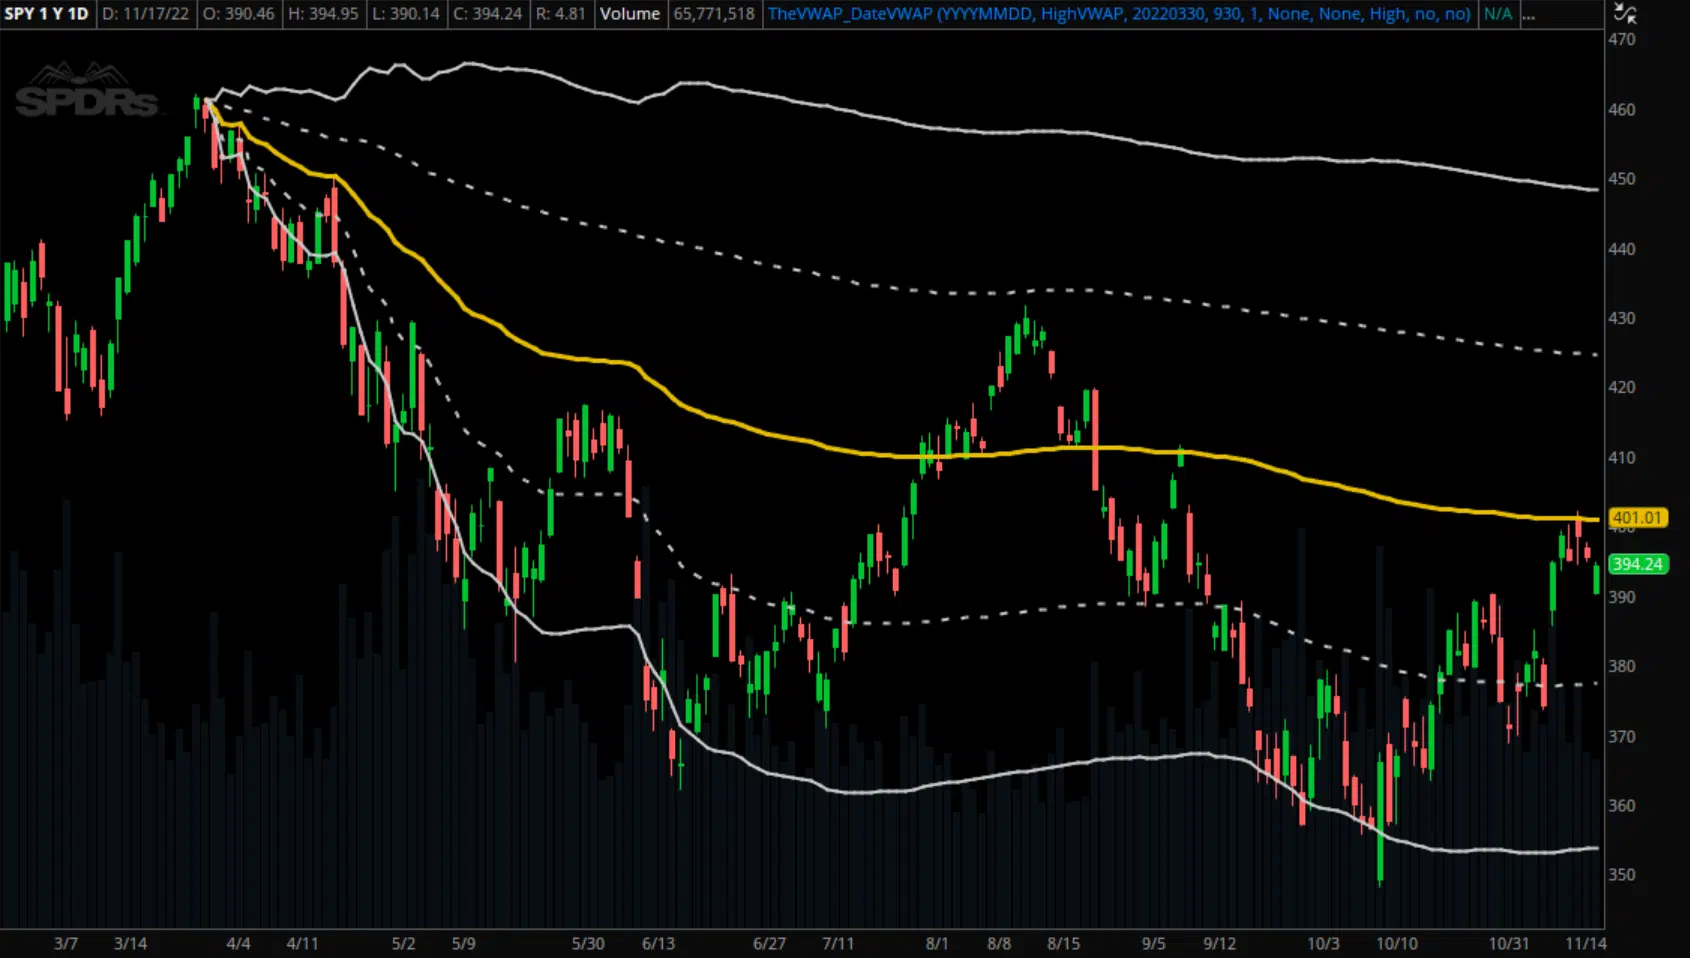
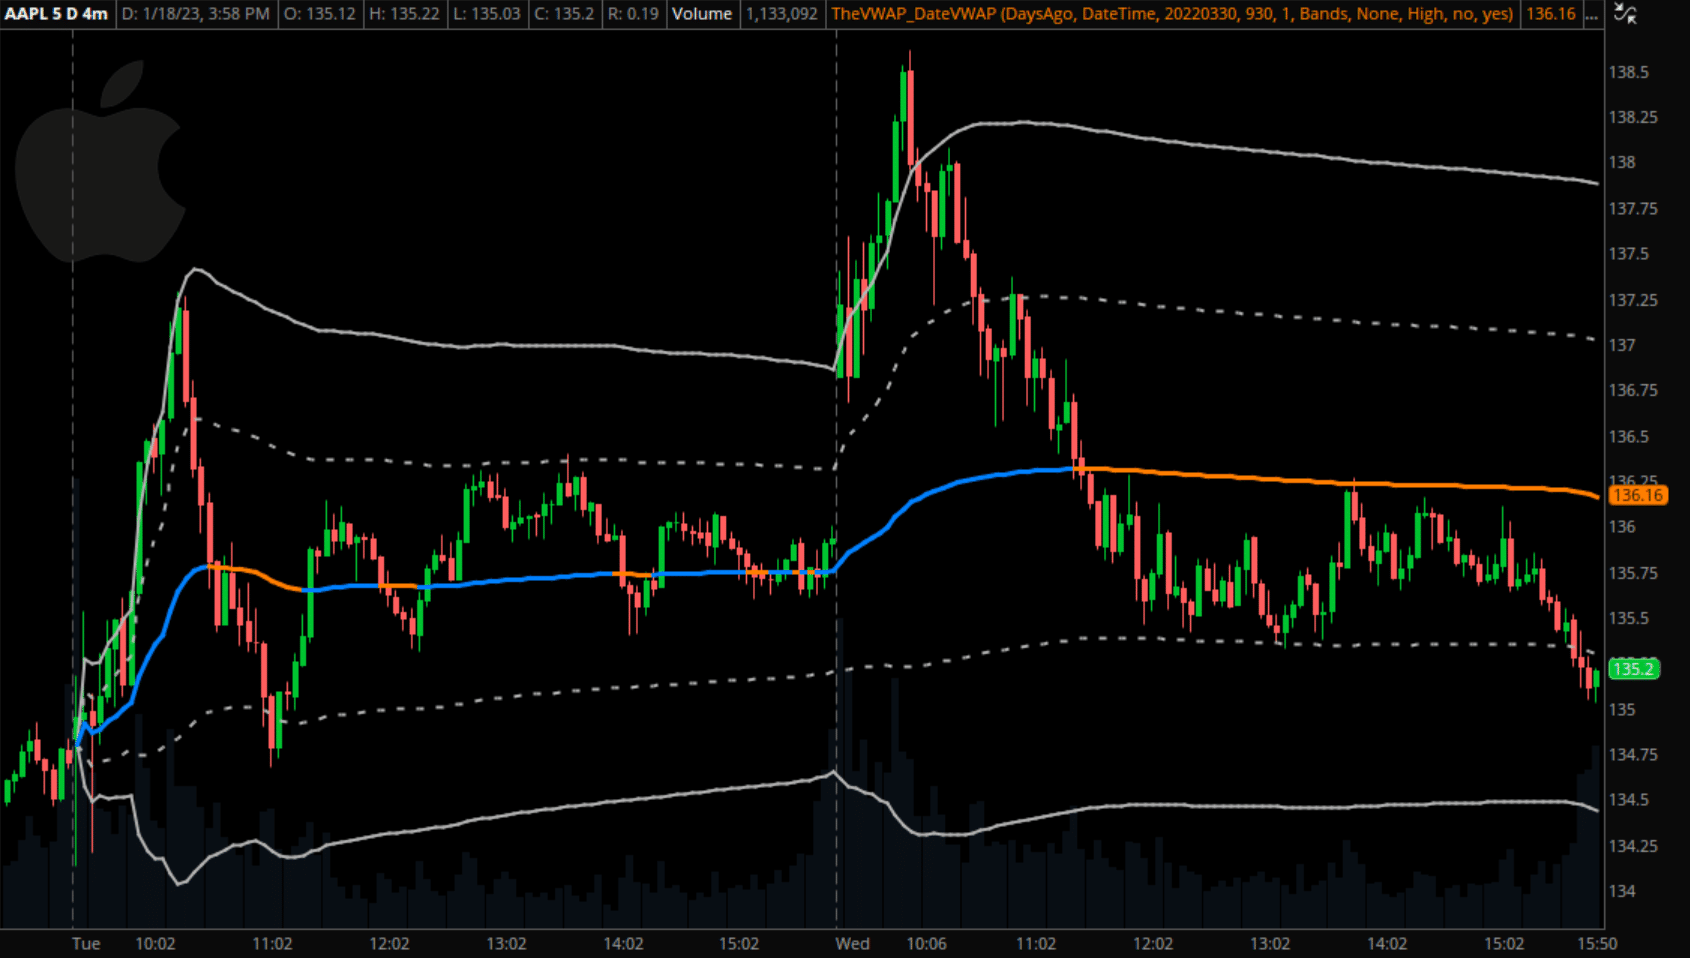
#2 — DateVWAP
Our all-in-one anchored VWAP tool for thinkorswim, which gives traders the ability to launch a VWAP and
optional standard deviation bands from any point in a chart's history.
By far our most powerful tool, DateVWAP includes multiple input options — YYYYMMDD HHMM, number of days
ago, or automatically identified highs and lows.
Core features:
Both manual and automatic input methods
Capability to plot standard deviation bands
Toggle on/off chart labels for quick analysis
Automatic preset to anchor to chart's IPO
#3 — Aspect
Measure and monitor the slope of intraday VWAP to gauge the intensity of price moves in either
direction.
Aspect is first and foremost a confirmation tool that we utilize to help
assess the quality of potential setups and gauge the likelihood of their continuation as they develop.
Core features:
Adjustable lookback period for slope calculation
Sensitivity presets for different market types
Customizable sensitivity input for full user control
DevWidth and Position (Z-Score) modes
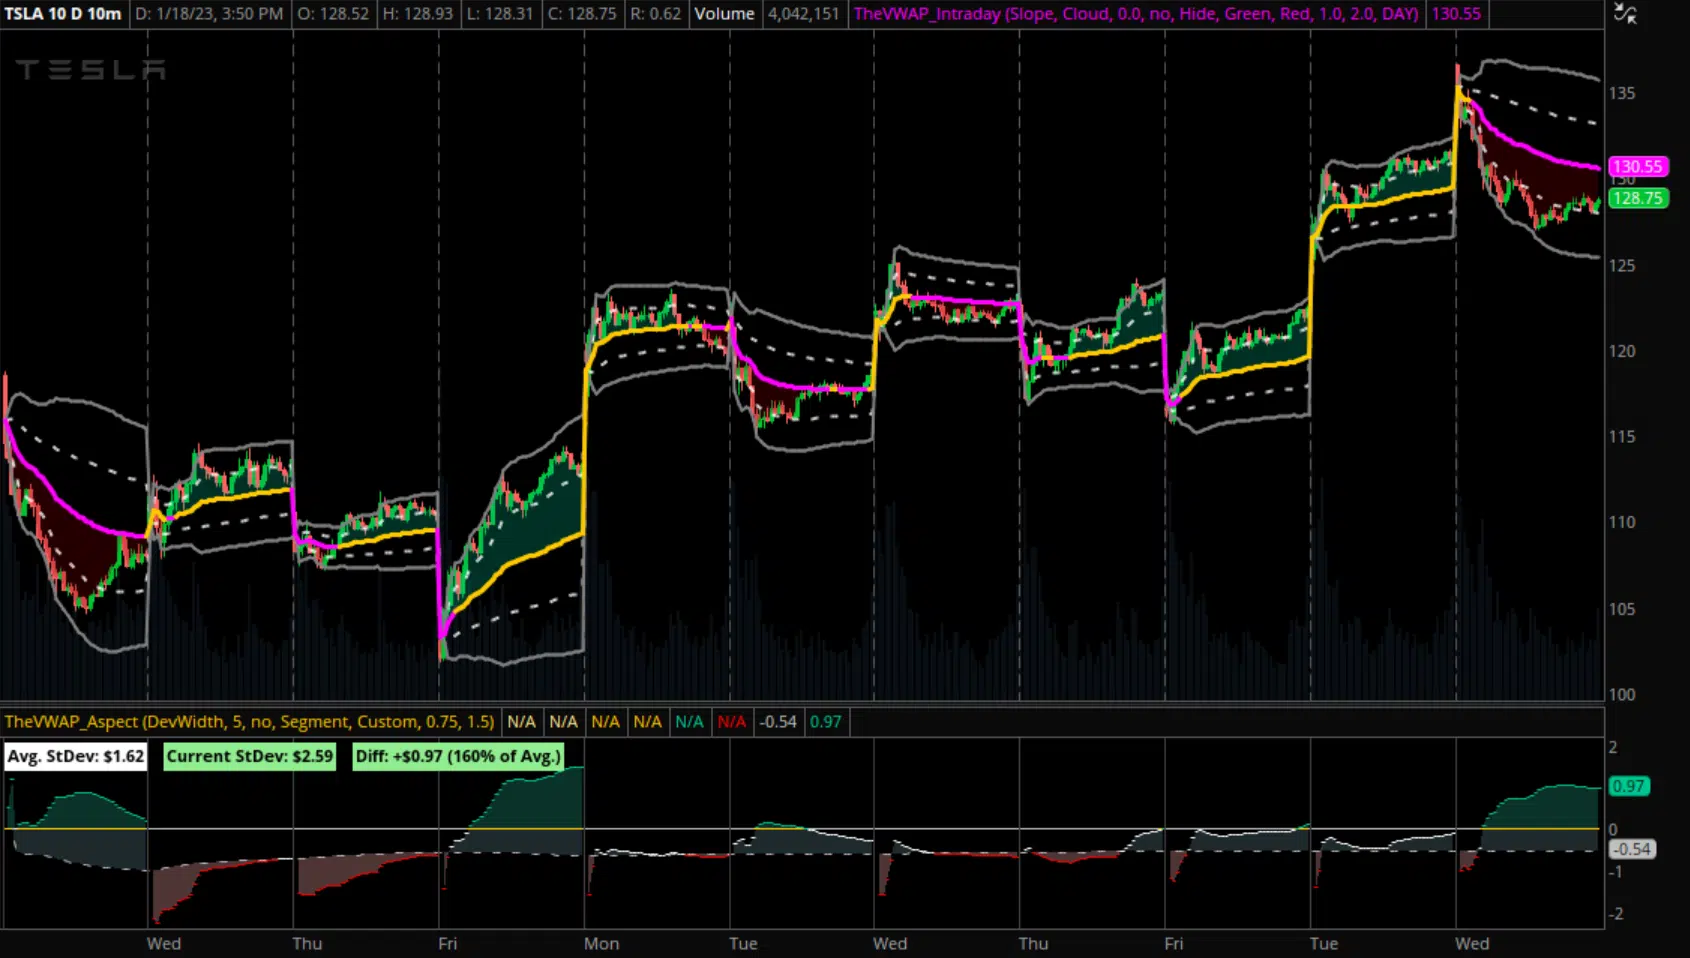
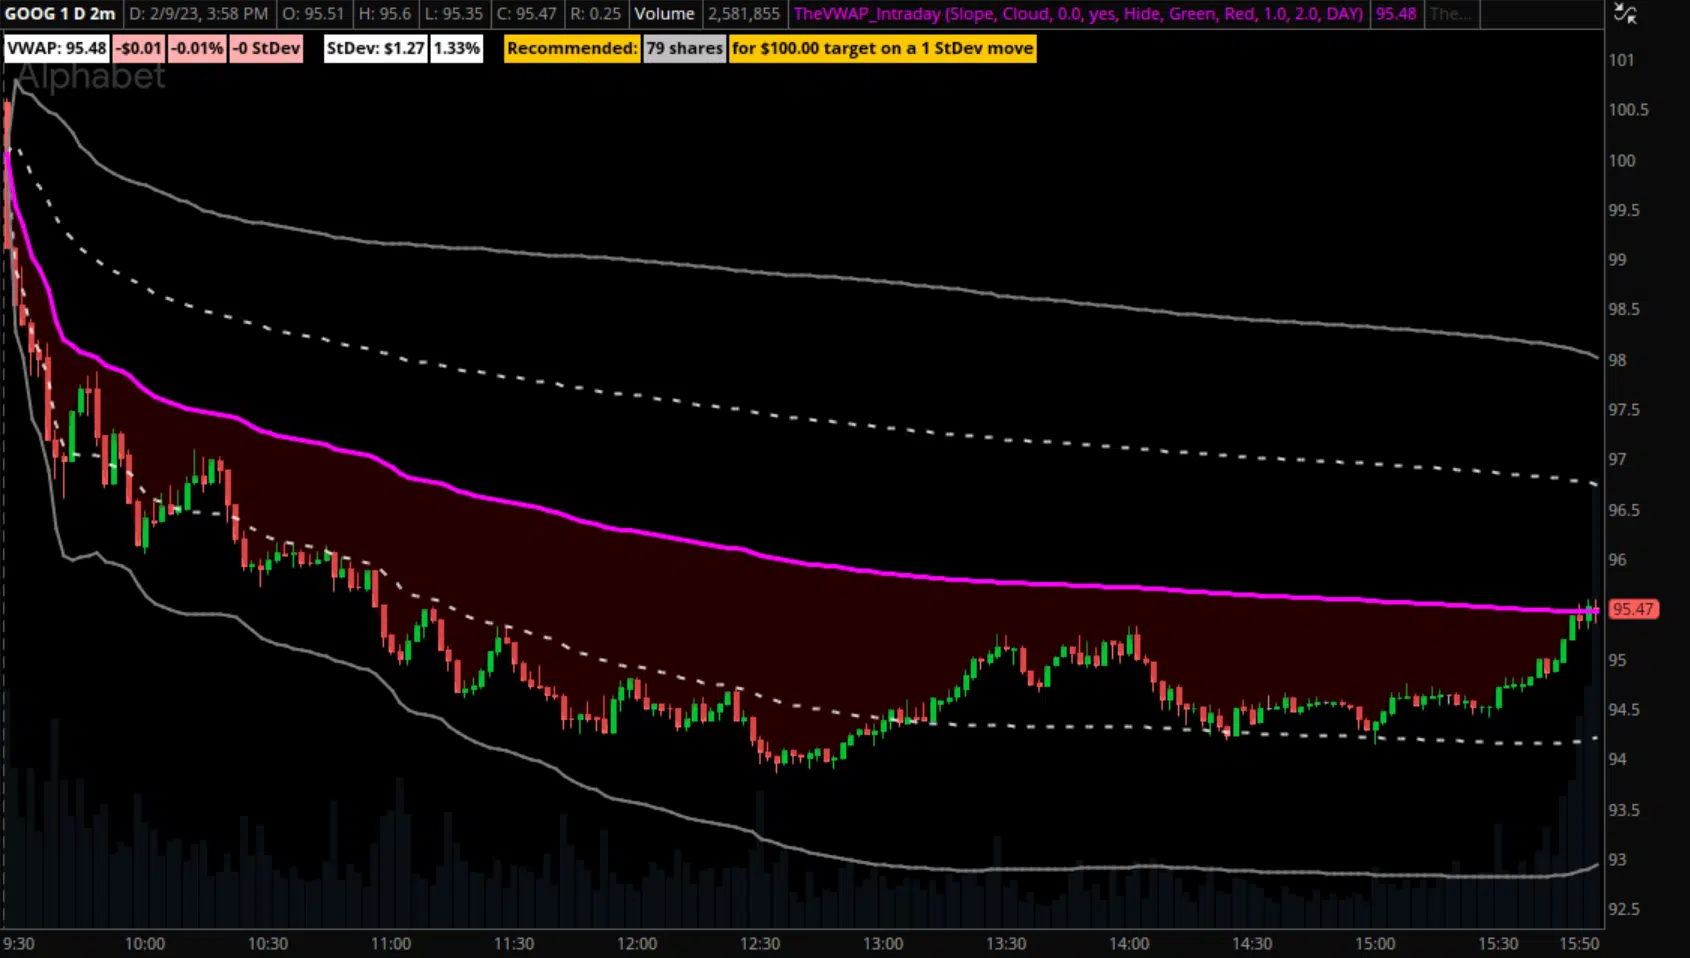
#4 — Dashboard
Just as the name implies, this indicator automatically calculate and displays several key VWAP metrics
in a consolidated dashboard.
When used in tandem with our free Intraday indicator, Dashboard allows traders to quickly assess a
chart's
volatility in the content of its intraday volume-weighted average price.
Core features:
Track deviation width and distance from VWAP ($ and %),
Position size calculator for rapid risk assessment
Compare current session's "VWAP move" to prior days
All metrics can be turned on/off by user
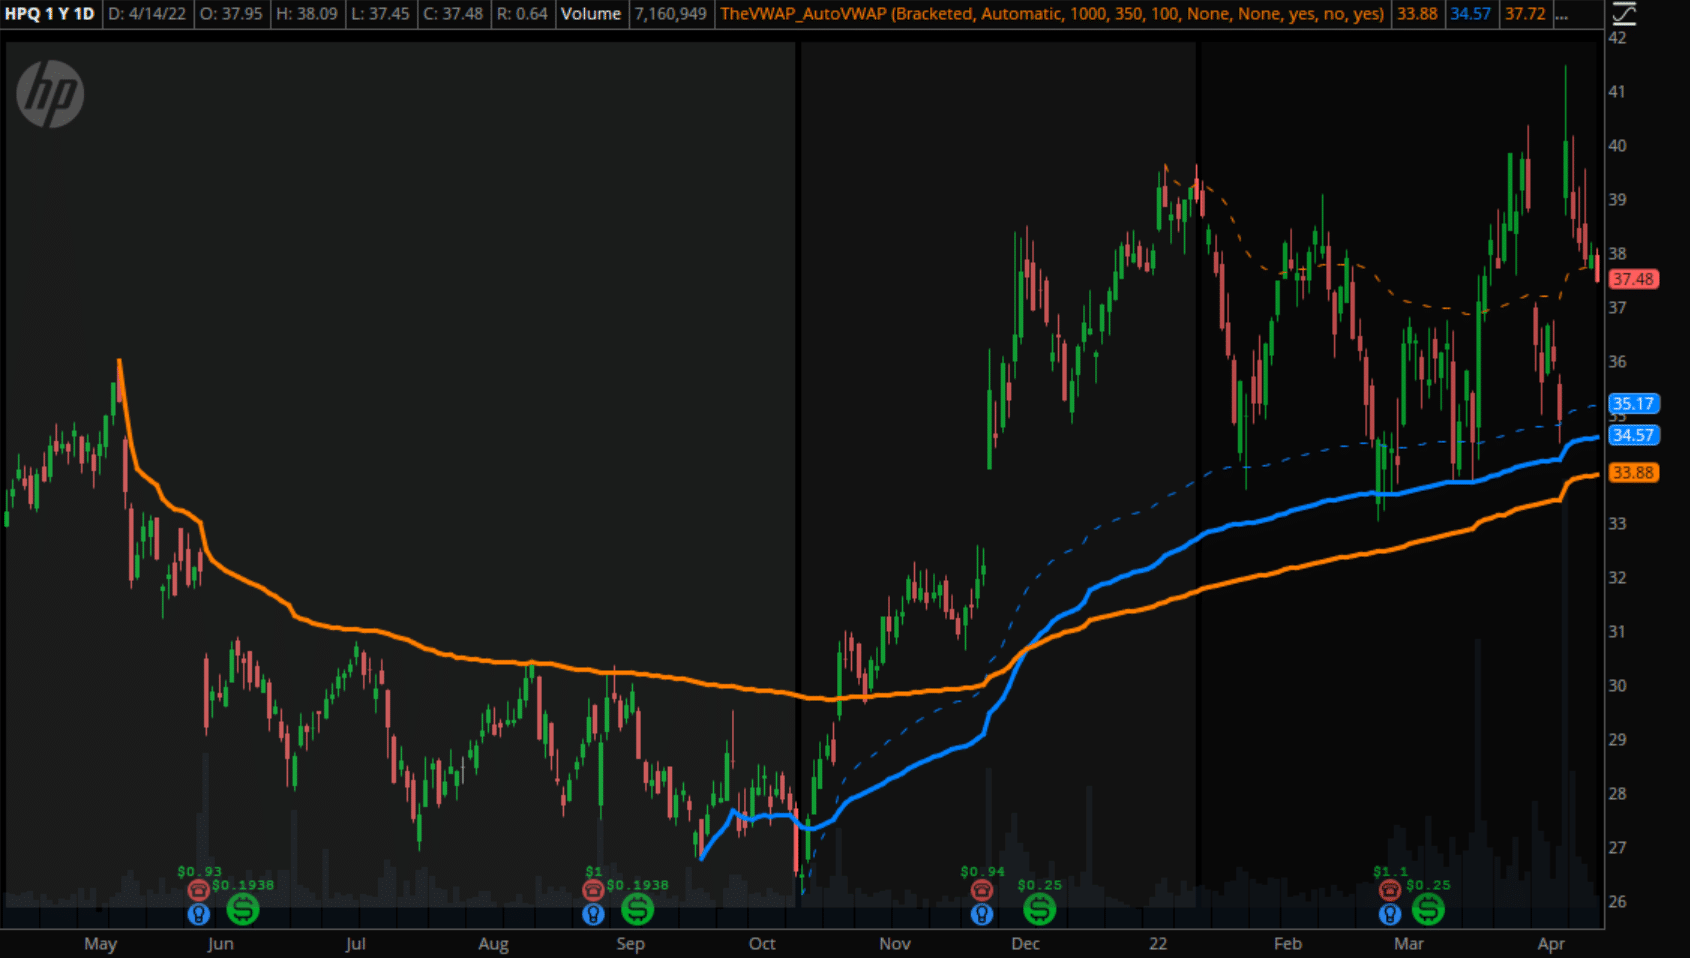
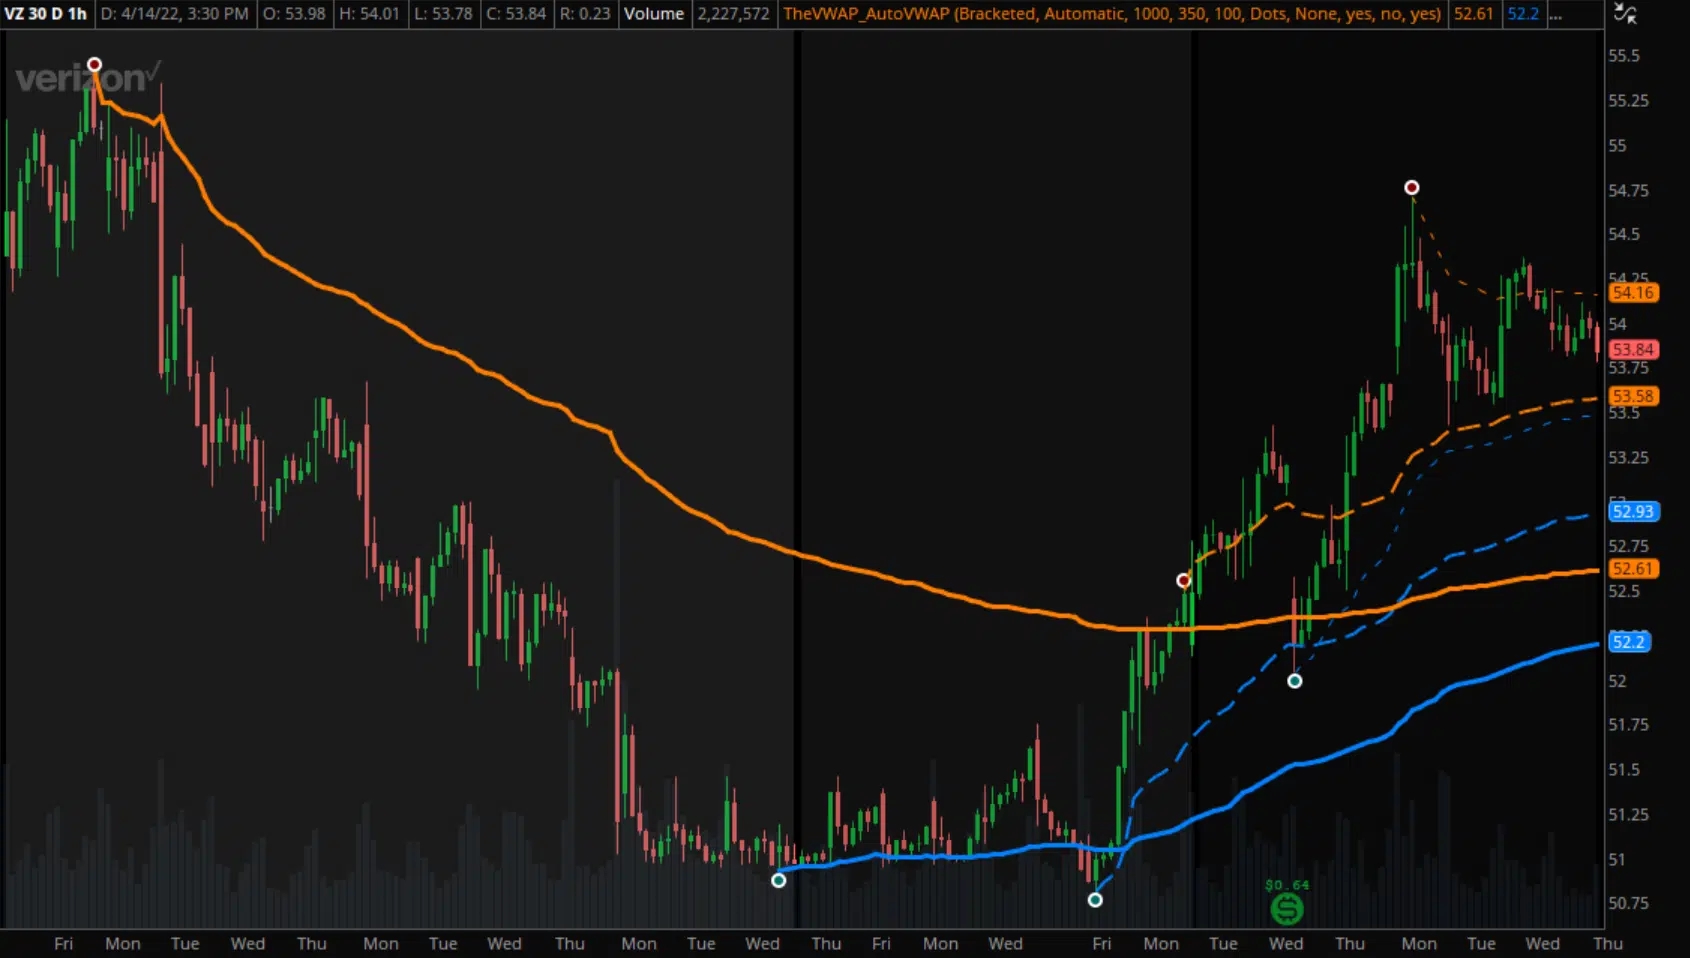
#5 — AutoVWAP
Another anchored VWAP indicator for thinkorswim, designed to automatically identify notable highs and
lows from any chart's history and launch VWAPs from those key levels.
AutoVWAP is designed to provide significant time savings and removes much of the guesswork typically
required when anchoring longer-term VWAPs.
Core features:
Automatic or Manual (find H/L within X bars) search methods
Option to visualize search zones and VWAP initiation points
Multiple highlight methods (line, dot, BarID) included
Works on any chart length or bar size (1-min, 5-min, etc)
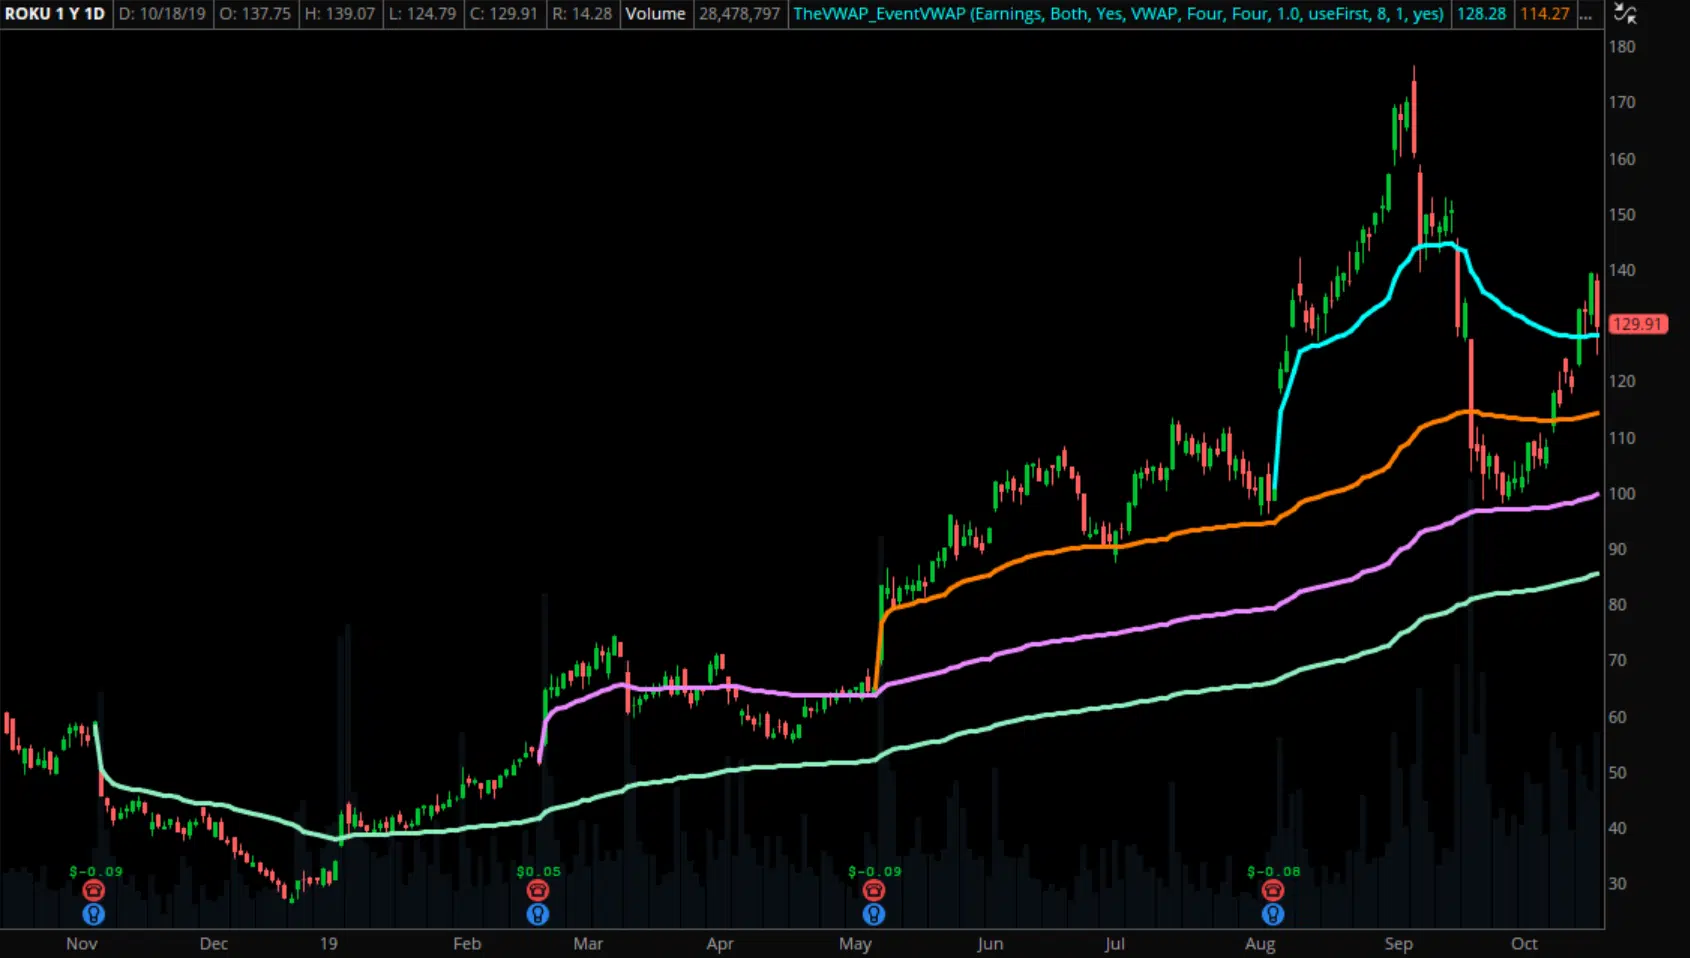
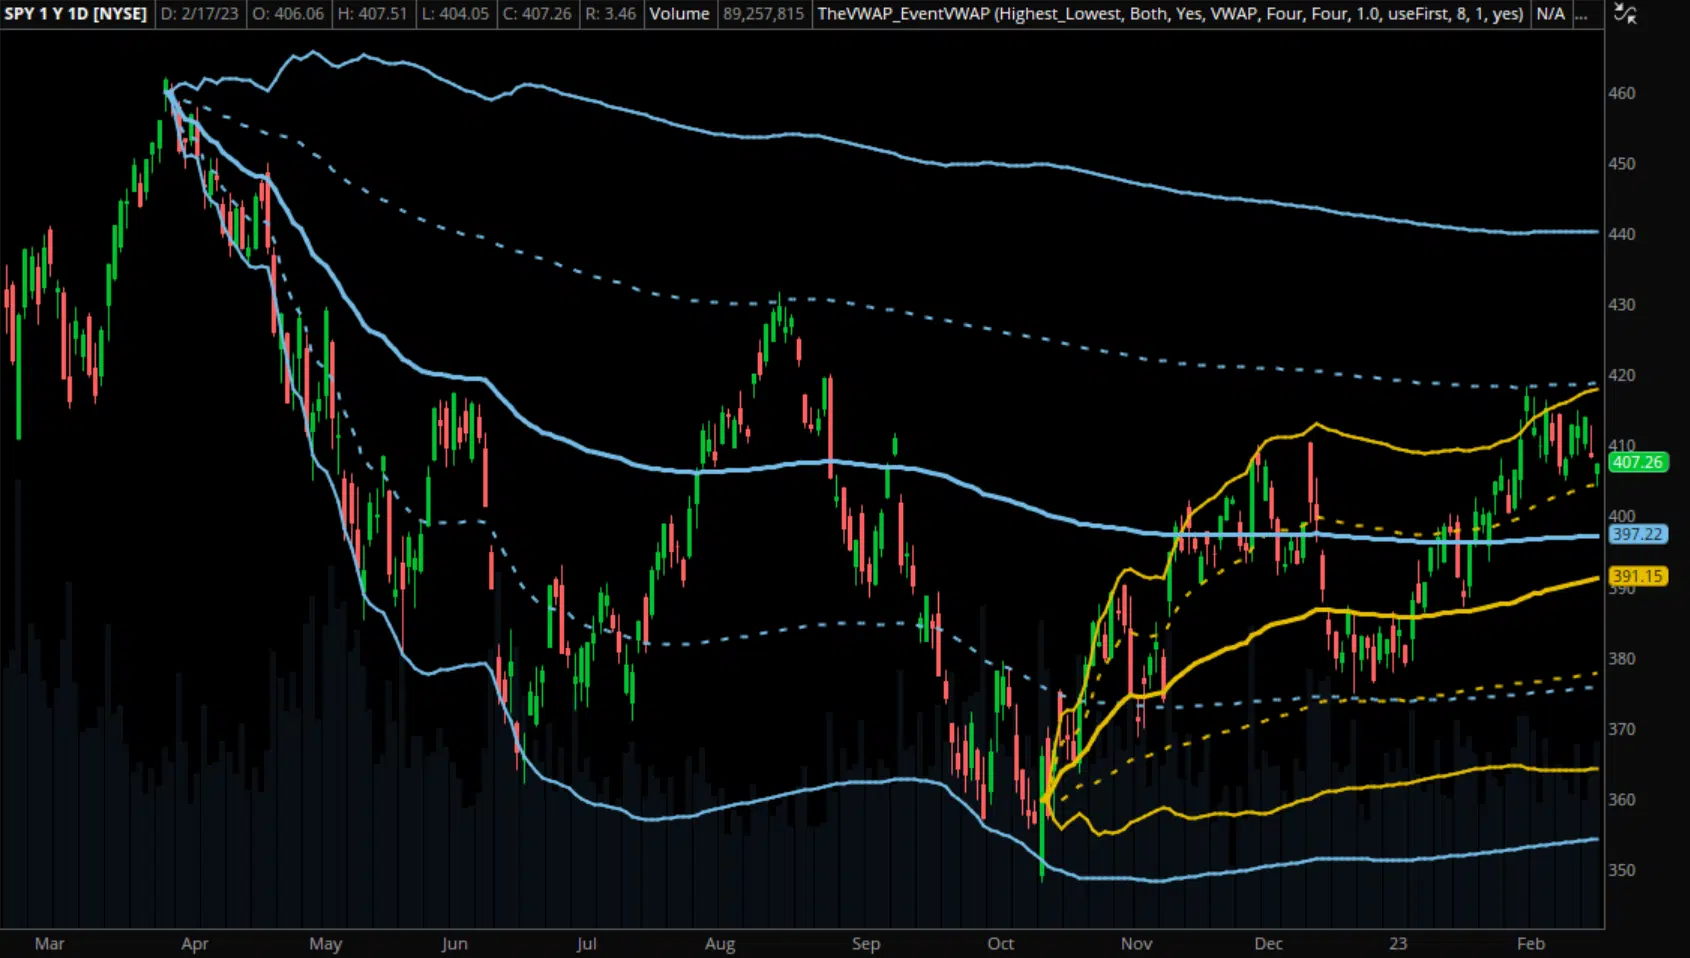
#6 — EventVWAP
EventVWAP is a specialized anchored VWAP indicator, built to automatically detect notable events in a
chart's history and launch VWAPs from those points.
It requires no manual date input from the user and instead provides a list of preset options to select
from — earnings, technical gaps, options expiries, etc.
Core features:
Presets for earnings, gaps, options expiries, and swing
Anchor up to four VWAPs of the same type at once
Optional standard deviation bands for all VWAPs
Adjustable gap threshold to qualify as anchor point
Get lifetime access to all six indicators for the price of three.
Platform Package — $225Frequently Asked Questions
Absolutely not. You'll have free lifetime access with no recurring fees, regardless of whether you sign up for VWAP On-Demand or purchase separately.
You'll be granted immediate access to our indicator portal, which contains download links for each indicator, tutorials, and import instructions.
Our indicator portal provides step-by-step instructions to help you add each indicator to your thinkorswim platform. And if needed, you're always welcome to reach out with questions.
We'll send you our "Intraday" indicator for free, plus a detailed tutorial.