Volume-weighted average price [VWAP] is a technical indicator that calculates and displays a market's average
transaction price for however long it's plotted.
Put simpler, VWAP represents the market's true average price for a certain period of time — most commonly
from the start of a trading session until the end. By adjusting for volume, it more accurately reflects the
impact of larger trades than traditional moving averages.
Despite its rise in popularity among retail traders in recent years, VWAP is still frequently underused and
misapplied by most. This guide discusses additional applications of VWAP that often go overlooked — standard deviation bands, anchored VWAPs, and more — as well
as addressing several misconceptions about how it should be used.
Make sure you also grab all of the other free resources we provide — custom indicators for multiple platforms, video lessons, and more.
How is VWAP calculated?
Mathematically, VWAP is the total amount of money transacted divided by the total amount of volume — either
shares or
contracts — over the same timeframe.
Think of it as the dollar-cost average of an individual position held in your portfolio, but extrapolated to
include everyone trading a given security instead of just your transactions. Consider the following
example:
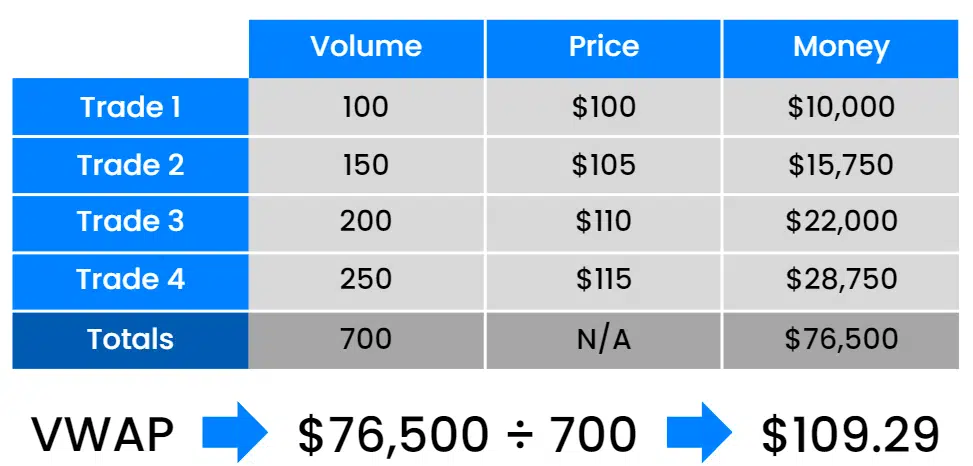
If only a single share of volume was transacted at each price, the average would have been $107.50. However, the
volume-weighted aspect of VWAP drags the average higher to $109.29 due to the disproportionately larger volume
at higher prices.
In reality, the calculated value of a VWAP incorporates the volume and price of every recorded transaction over
the duration for which it's plotted.
It’s also important to note that VWAP is a cumulative calculation, rather than periodic. This means that it
builds upon itself as time progresses, incorporating new price and volume data as it develops without leaving
"old" data behind. We’ll discuss the importance of this detail later on in the guide.
How is VWAP used?
The use of VWAP has evolved over time, but it’s been widely utilized by institutional trading firms for decades
— originally serving as
an execution benchmark.
Fulfilling sizable client orders while minimizing market impact often requires trades to be broken down into
several smaller transactions. The dollar-cost average of those collective transactions could then be compared to
the VWAP over the acquisition timeframe to assess its quality.
“Did you get a good buy price on those 200,000 shares of XYZ?” could be responded to with, “Yeah, a few cents
below the VWAP measured from when that order came in” — evidence that the filling broker did a good job of
buying intelligently and opportunistically, rather than merely chasing the stock up and entering at a
disadvantageous price.
The introduction of automated execution and profit-generating algorithms centered around VWAP have further
solidified its importance and impact, as well as an increasing number of retail traders that now utilize it as a
technical indicator.
Core Concepts to Know
There are a few key things about VWAP that we believe all traders should know, and they simultaneously address some of the most common misconceptions and FAQs we receive.
VWAP is cumulative, while most technical indicators are periodic.
To use an analogy, think of a chart as a portrait drawn candle-by-candle. Imagine if you could only see the last
9, 20, or 50 brushstrokes made by the artist while everything painted beforehand disappears from view as they
progress.
This is the limitation of periodic indicators. Any data from beyond the arbitrary lookback period you select —
i.e., a 20-period simple moving average — is no longer factored into the indicator’s calculation, leaving you
with an incomplete picture of the market.
VWAP’s calculation is cumulative, anchoring to a specific point and building upon itself over time. No piece of
data gets left behind, providing you with a start-to-finish view of the portrait as it develops. Each
transaction that occurs should factor into how we interpret the current state of the market and what’s more
likely to happen next.
VWAP isn’t susceptible to changes in type, length, or timeframe.
In addition to the increased context it provides, the cumulative calculation of VWAP also prevents confusion
regarding chart time frames and settings — unlike moving averages or other periodic technical
indicators.
Using a 20-period simple moving average on a 1-minute chart versus a 10-minute chart will produce noticeably
different values, but this is not the case with VWAP. If using the proper calculation, the value of VWAP will
remain constant regardless of the aggregation period.
It will always represent total money divided by total volume, no matter how you organize that data. There is
ultimately only one true VWAP over any defined period of time.
VWAP acts as a magnet, capable of either attracting OR repelling.
One of the most commons myths about VWAP is that price is always attracted to it. This is false,
and such interpretation leads to an oversimplified approach of “short anything above VWAP and buy
anything below” with the expectation that a reversal is imminent.
If this were true, we’d never witness any sustained intraday trends. The reality is more nuanced. Price can
be drawn towards VWAP in some instances, but it can also be actively repelled away from it in others.
Being able to distinguish between those two environments is crucial, and it’s something we touch on in one of
our freely available video lessons.
VWAP has the tendency to continue on its current path.
By adjusting for volume in its calculation, VWAP is inherently more responsive to price movements with
significant volume versus those that occur with less. And as VWAP incorporates more and more transaction data
over time, its cumulative nature also makes it more resistant to random oscillations and sudden shifts.
Collectively, these two components bolster its credibility as a more objective reference point that can not be
easily manipulated — only responding more aggressively when real, substantive amounts of money are moving the
market.
We call this the "inertia" of VWAP, making it more steadfast and reliable than other short-term indicators that may spit out theoretical buy/sell signals every couple of minutes.
VWAP is an Event-Driven Average
The underlying idea behind VWAP is the launching of a cumulative, volume-weighted average from an anchored
starting point. And although it’s most commonly implemented as an intraday indicator plotted from market open to
market close, limiting VWAP to this singular application is a big mistake.
Instead, we view volume-weighted average price as an “event-driven average” with significantly more use cases.
The open of a new trading session is one of the possible events that we can utilize as an anchor point, but
that’s only scratching the surface.
At TheVWAP, we use a set of custom indicators to actively explore the use of anchored VWAPs with both
longer-term and shorter-term durations. These anchor points include, but are not limited to:
- Macroeconomic reports
- Earnings releases
- Overnight gaps
- High-volume occurences
- Notable highs/lows
The way we implement and interpret these anchored VWAPs is not always the same as the ways in which we utilize intraday VWAP, but they play a unique and significant role in our framework in their own right.
VWAP and Standard Deviation Bands
Without a suitable metric to measure the current distance between price and VWAP, we’re left with a
drastically oversimplified evaluation method — “are we above or below?”
The solution? Standard
deviations are an objective, statistical measurement that are used to quantify the amount
of variation in a data set. Smaller values indicate that most data points are close to the calculated average,
while larger values indicate a wider range.
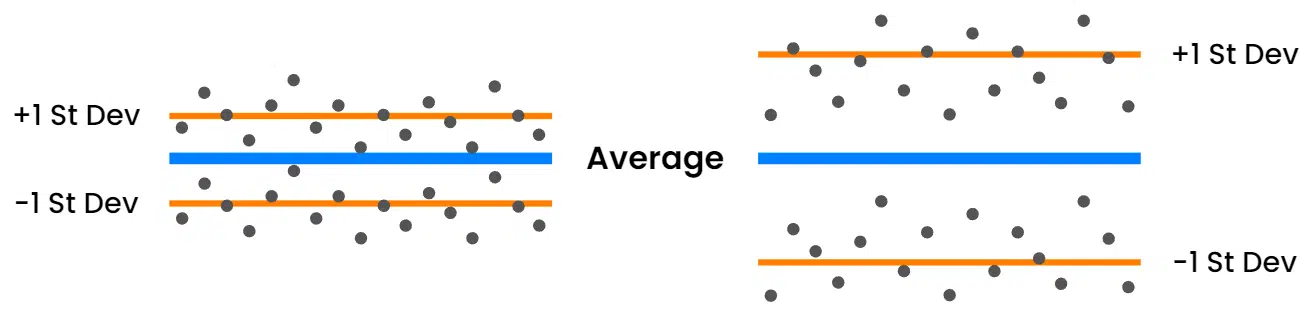
By applying this concept with all transactions serving as the data set and VWAP as its average, we can calculate and plot standard deviations as bands on our chart to create a visible unit of measurement. And through the use of these bands, we can characterize market movement in relation to VWAP and gauge the volatility of any traded instrument.
Standard deviations succeed where dollar and percent measurements cannot, standardizing volatility across trading instruments of all sizes.
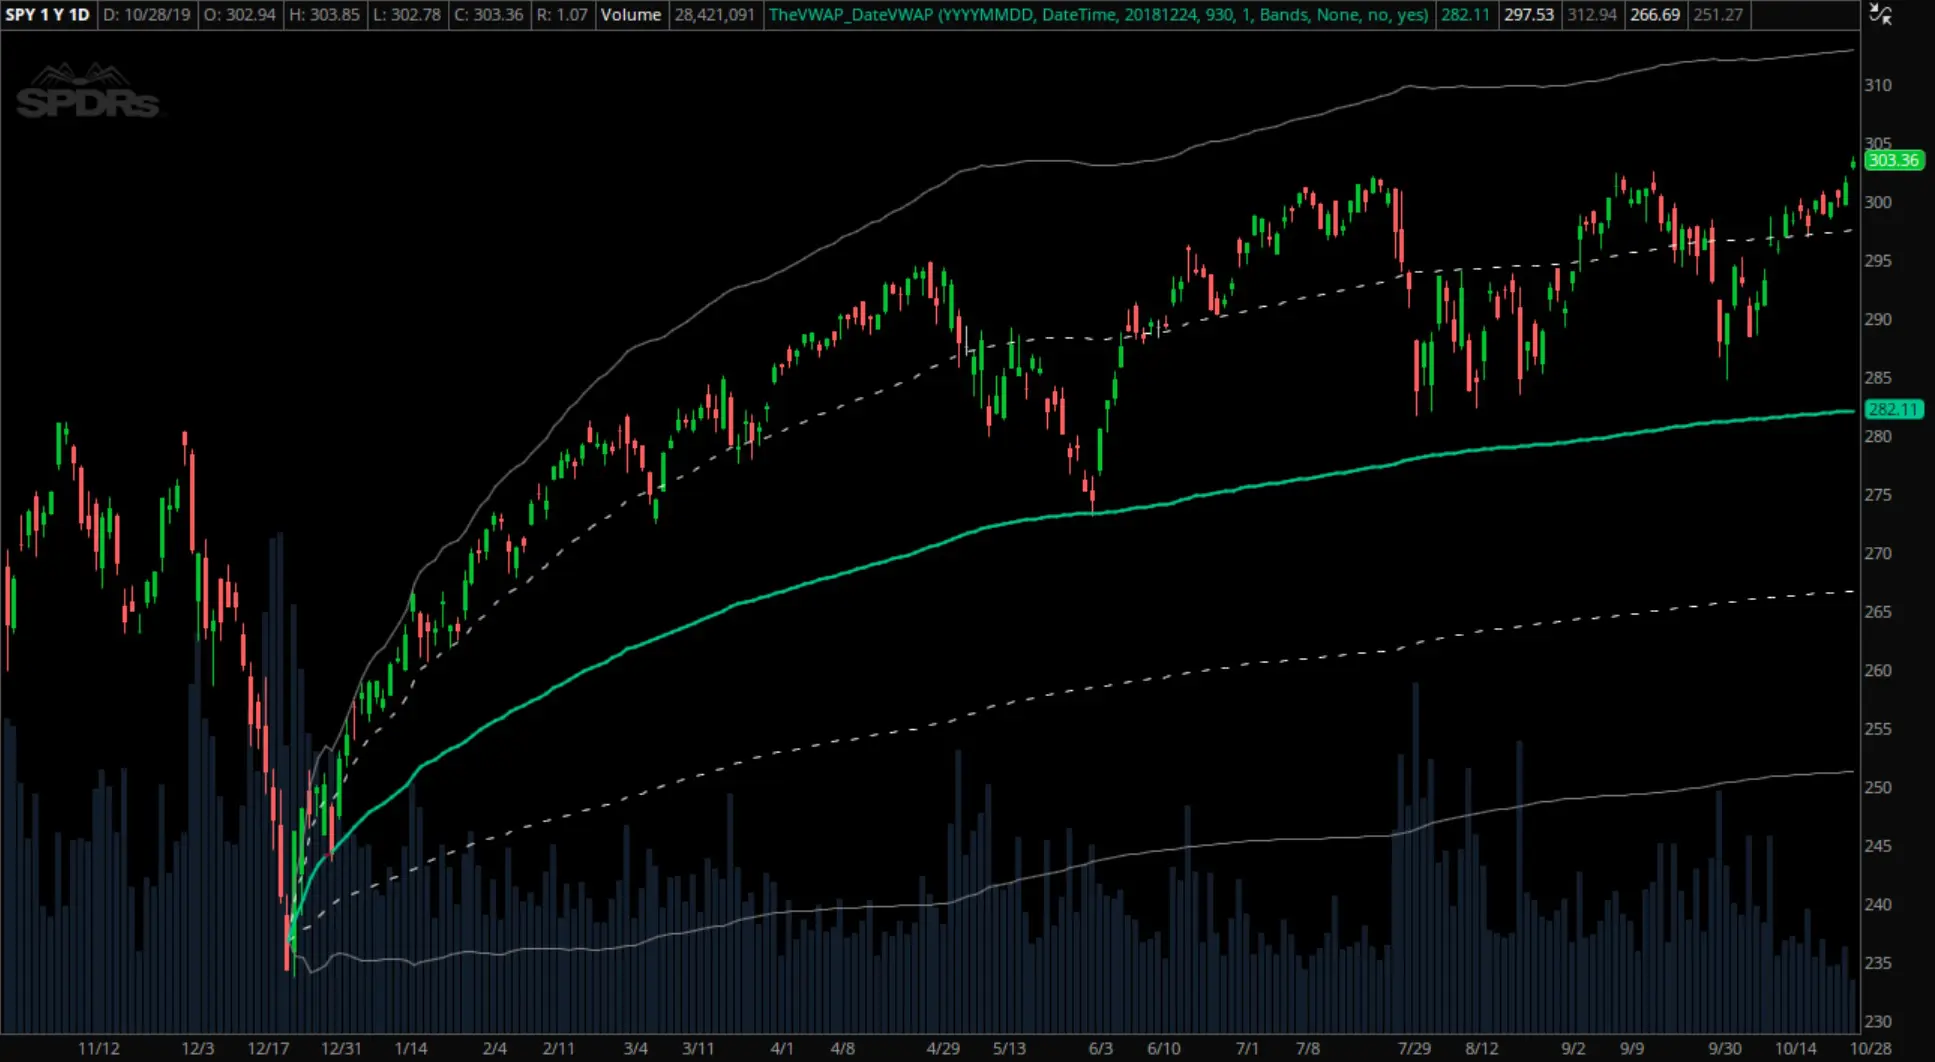
Consider the chart examples of SPY and COP found below. Despite the vastly different closing prices of each
($431.85 for SPY and $34.06 for COP), applying intraday VWAP with the +/-1 and +/-2 deviation bands
normalizes their volatility and allows us to analyze them through the same lens.
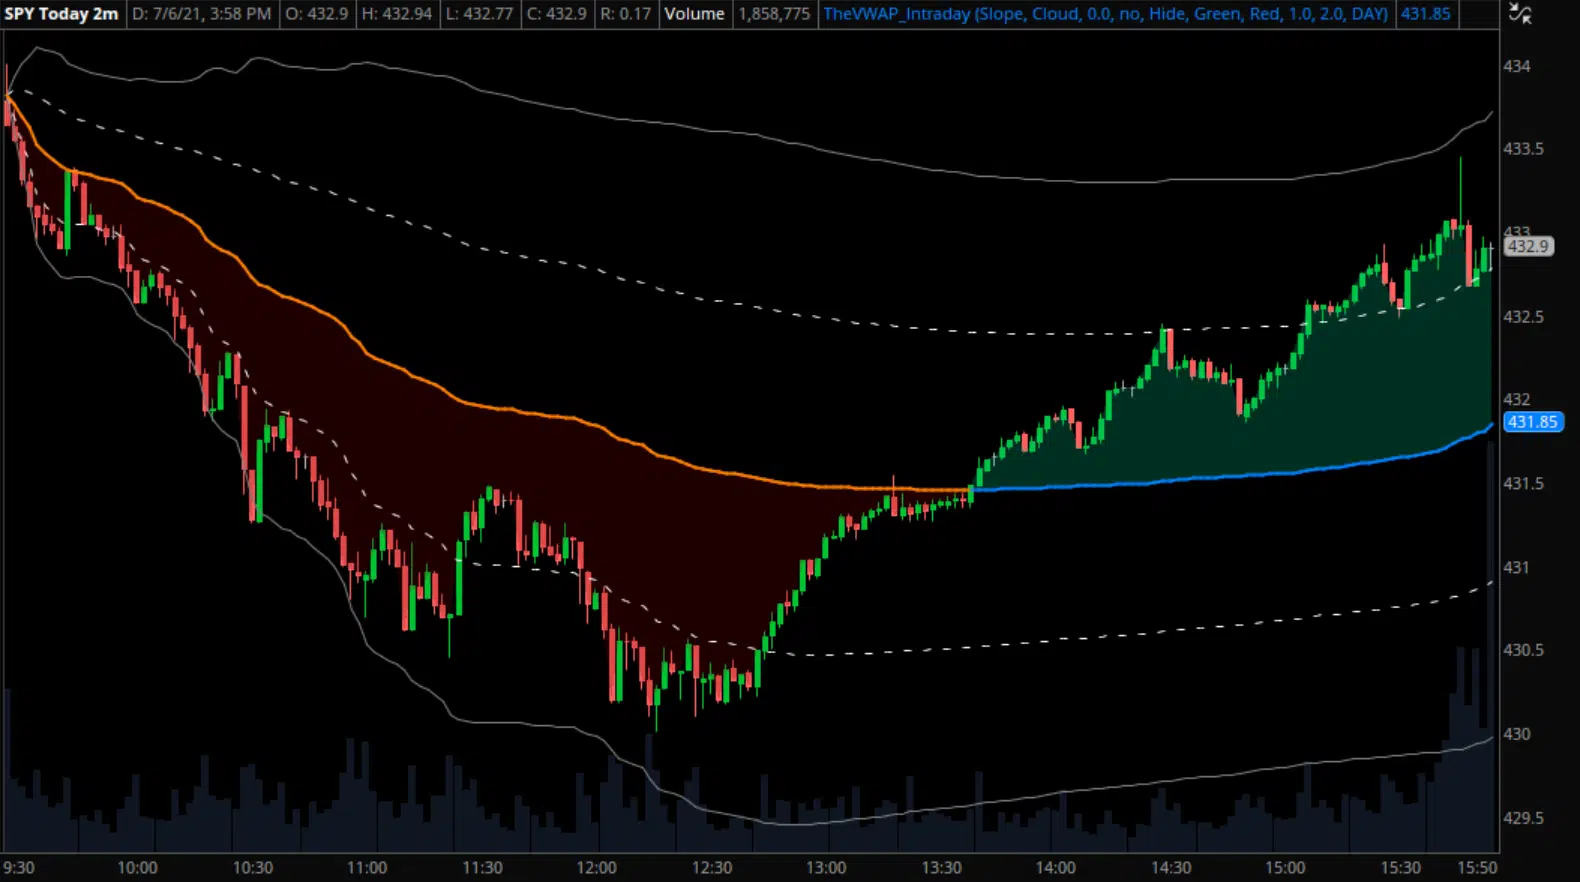
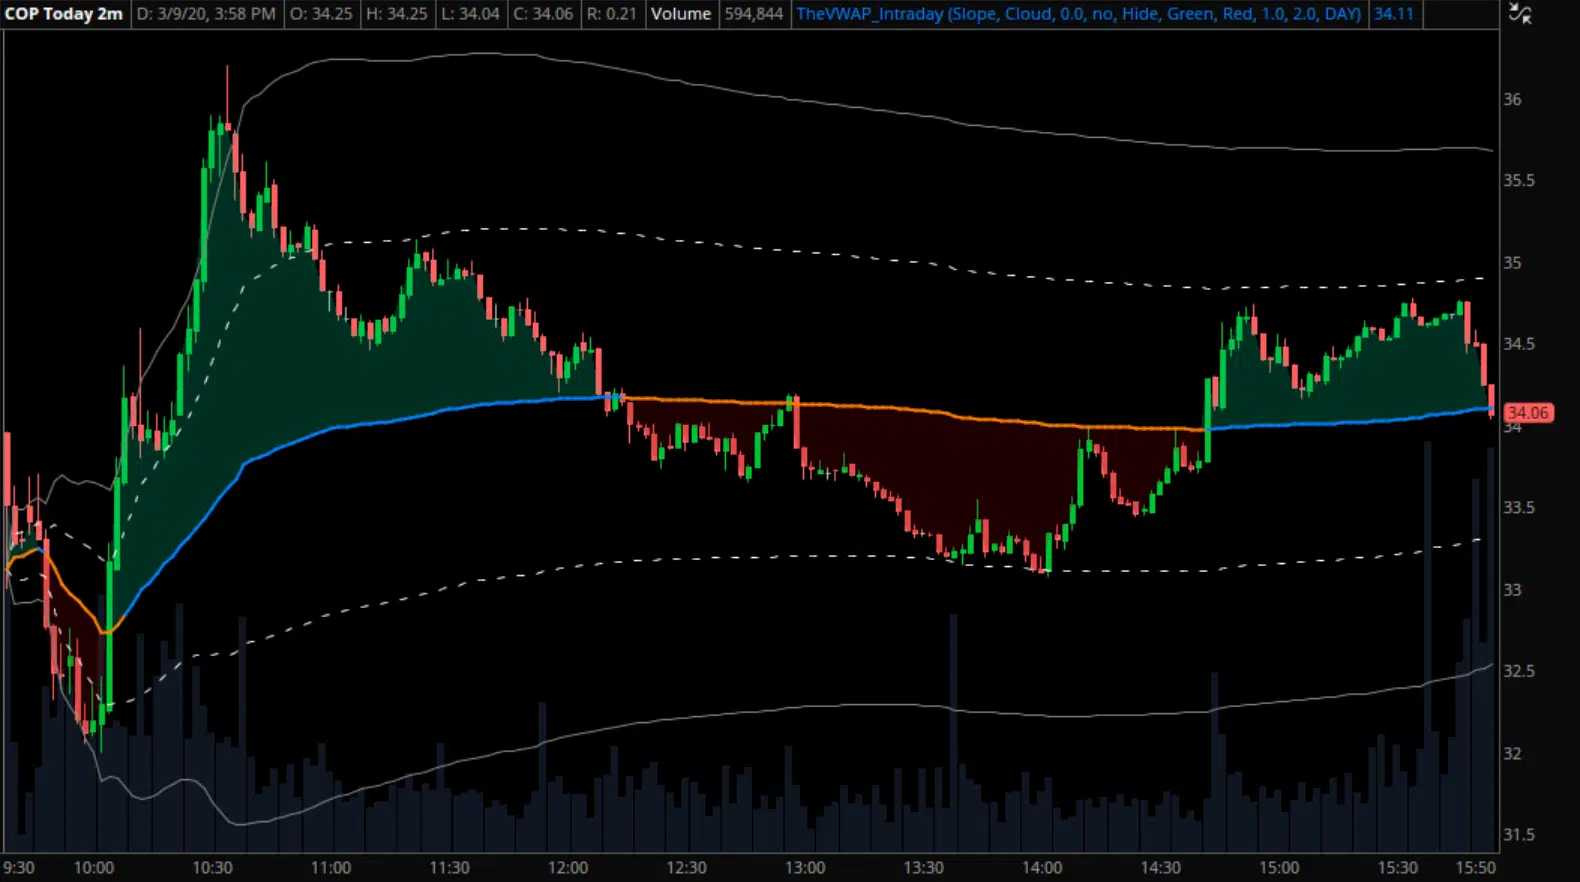
Standard deviation bands are plotted continuously alongside VWAP, automatically adjusting as more data is
received — expanding or contracting as needed. The rate at which they do so depends on how far away
from VWAP we trade and how much volume is being transacted when we do.
In the context of intraday VWAP, these dynamics will often result in standard deviation bands that gradually
expand in trending environments and either remain stable or contract in consolidating environments.
Building a strategy around VWAP
Applying VWAP and its standard deviation bands to any chart creates a universally applicable grid
system. Like lane markers on a road, we can use this grid to group market activity into distinct
zones — each with a different set of unique characteristics and expectations.
Price crossing between these zones is often a noteworthy event, and in many cases the attempts to do so will be
met with resistance. As a result, the barriers that separate them frequently serve as areas
of technical support and resistance that otherwise go unseen.
By combining VWAP and deviation bands with overlaid anchored VWAPs, broader price patterns, and other analysis
techniques we utilize, we can create an overarching framework that we use to answer several key questions, like:
Is this market trending or chopping?
Many traders view all charts as “long or short?”, but we believe that perspective is misguided. During periods of chop — aka random consolidation — there’s no discernible edge if you’re thinking directionally. Being able to distinguish between market types to help determine when you shouldn’t trade is arguably as important as knowing when you should.
Where will I be interested in an entry?
If you’re interested in a trade, you now need to determine where it would make sense to enter. We look for several predetermined setups for this purpose, all based on the context of the chart and proximity to anticipated support or resistance levels. Patience is a virtue here.
Where is my stop?
Implementing an effective framework and strategy is important, but it doesn’t negate the need for risk management. Any trade you take should have a clear plan before you enter, including an understanding of where on the chart your idea will be proven wrong. That invalidation point should be your stop — not just a random price that you decide to use.
If my trade is successful, how will I manage it?
With your entry area and stop established, your risk is defined and your downside is protected. But you also need to know how to manage and maximize a position that moves in your favor. Identifying support or resistance levels in your path, partial profit-taking areas, and more — VWAP in its totality can be used for all of it.
Key Takeaways to Consider
At its core, the goal of incorporating technical analysis in your trading is to:
- Analyze charts to find potential areas of opportunity that align with your goals.
- Aim to enter a trade at a credible support/resistance level with defined risk and reward.
- Monitor the likelihood of continuation vs reversal to best optimize your eventual exit.
When applied correctly, we believe volume-weighted average price and its often-overlooked applications —
standard deviation bands, anchored VWAPs, slope, etc — can collectively satisfy all of these criteria.
It’s not the holy grail — no indicator or technical tool is. It won’t save you from undisciplined trading or
poor risk management, but it can greatly simplify the process of identifying higher-quality opportunities and
participating in them with a calculated and favorable risk/reward ratio.
Institutionally-recognized and statistically valid, VWAP should be a part of every technical trader’s set of
tools. And to help you get started, here’s a few basic tips:
Don’t get burned by misreading the magnetism.
Like we mentioned earlier, it’s a mistake to assume that price has to return to VWAP. It’s an often-repeated
myth that can quickly get you into trouble if you’re always looking to fade any moves above VWAP and bounce any
moves below.
The reality is much more nuanced, and adding standard deviation bands can be a good starting point. To do so, try out one of our free custom indicators.
Only trade instruments with sufficient volume.
VWAP is effective on all kinds of different instruments, and we have members that trade stocks of all sizes,
futures, cryptocurrencies, Forex, and bonds. However, the necessary caveat is that the markets you’re focusing
on have sufficient liquidity — ideally on a consistent basis.
The less volume there is, the less reliable VWAP can become. Not to mention the broader issues with illiquid
markets like wider bid-ask spreads and poor fills on executions.
Avoid using it during certain times of the day.
In the majority of instances, VWAP is going to be less reliable during pre-market, the first 30 minutes of the
session, and post-market.
Pre- and post-market activity often lacks sufficient liquidity, and the large influx of volume in the opening
half our of the regular trading sessions leads to more random swings in the value of intraday VWAP while it
begins to establish itself.
Interested in learning more? Sign up for our free toolkit and we'll send you custom indicators, video lessons, and more.
Start with our free toolkit.
Custom-coded indicators
Exclusive video lessons
Comprehensive webinar