Intraday for thinkorswim

TOS Logo 5

Download the indicator and read through the tutorial provided below.

Indicator Tutorial

Click on the options below to read more about Intraday’s settings on TOS.

Import Instructions

The folder you will download above needs to be extracted/unzipped before importing to thinkorswim. If you don’t do so, the file will not be available to add through your platform.

Also, after unzipping the folder please do not click to open the “.ts” file outside of thinkorswim. Doing so will likely result in an error saying something similar to “This file isn’t playable. That might be because the file type is unsupported, the file extension is incorrect, or the file is corrupt.”

If necessary, you can click here to find step-by-step import instructions for the indicator.

VWAP Color

Determines how the color of VWAP is displayed. Here are the available options:

Slope (default) — The color of VWAP will change dynamically based on the current slope of VWAP. If selected, you can choose your desired colors using the “VWAP Ascending” and “VWAP Descending” color palettes in the “VWAP” tab of the Plots section.

Single — The color of VWAP will remain the same at all times. If selected, you can choose your desired color using the “VWAP Single Color” color palette in the Plots section.

Background Color

Controls the display style of the clouds on either side of VWAP. Here are the available options:

Cloud (default) — Displays clouds of two different colors — one for above VWAP and one for below. If selected, you can choose your desired colors using the “Above VWAP (Cloud)” and “Below VWAP (Cloud)” color palettes in the “VWAP” tab of the Plots section.

Fast Lane — Displays clouds only in the space between the +/-1 and +/-2 deviation bands. If selected, you can choose your desired colors using the “Fast Lane +” and “Fast Lane -” color palettes in the “VWAP” tab of the Plots section.

Cloud and Fast Lane — Combines the two options above, displaying four different colors.

None — Turns off all cloud displays.

Time Frame

Select your desired timeframe for VWAP. Here are the available options:

Day (default) — The option you’ll likely use most frequently. A standard intraday VWAP that resets at the beginning of each new trading session.

Week — Plots week-to-date VWAPs, using the first trading day of each week (or the leftmost point on the visible chart) as an anchor point.

Month — Plots month-to-date VWAPs, using the first trading day of each month (or the leftmost point on the visible chart) as an anchor point.

St Dev 1 & 2

Controls the values of the displayed deviation bands. We highly recommend leaving these set to 1 and 2, which will plot the +2, +1, -1, and -2 deviation bands around VWAP. If both are set to 0, no deviation bands will be displayed.

Tolerance Band Width

Displays additional bands around the +1 and -1 deviation bands, expressed in standard deviations. We discuss their use in VWAP On-Demand.

Plots & Styling

This section controls the styling for the available plots. Here are the available tabs:

LowerBand_1 — Controls the -1 deviation band by default.

OuterBand_H — Controls the tolerance band above the +1 deviation band by default.

InnerBand_H — Controls the tolerance band below the +1 deviation band by default.

InnerBand_L — Controls the tolerance band above the -1 deviation band by default.

OuterBand_L — Controls the tolerance band below on the -1 deviation band by default.

VWAP — Controls the displayed VWAP by default.

UpperBand_2 — Controls the +2 deviation band by default.

LowerBand_2 — Controls the -2 deviation band by default.

UpperBand_1 — Controls the +1 deviation band by default.

Import Instructions

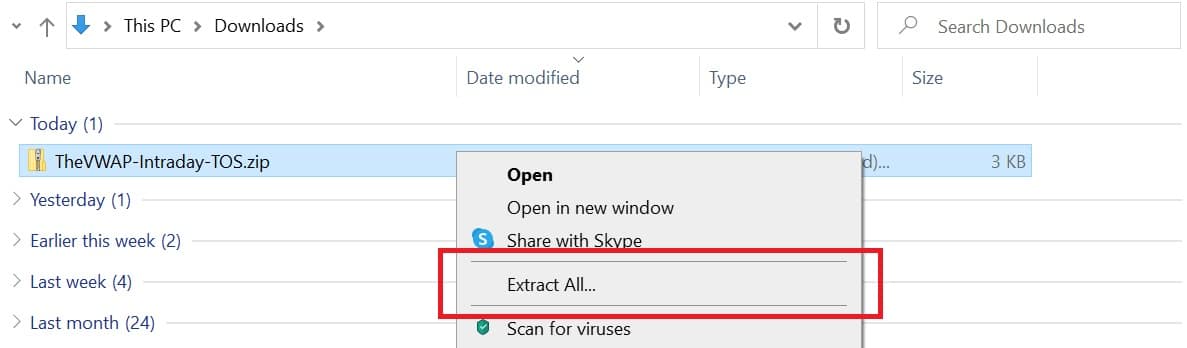
Step 1 – Download the code by clicking above. The indicator will appear as a zipped folder titled “TheVWAP-Intraday-TOS”. Open your Downloads, right-click the folder and select “Extract All”. Click Browse, choose your desired destination for the unzipped folder and then click “Extract”.

free-VWAP-indicator-thinkorswim1

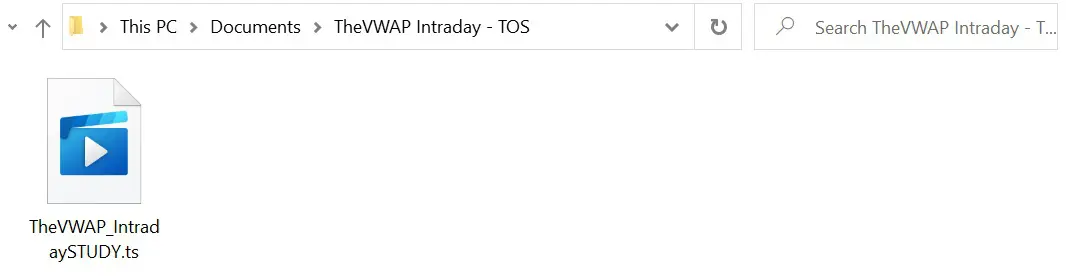
Step 2 – Your unzipped folder should contain one TOS code file. It may appear as an audio/video file and produce an error if you attempt to open it, but this is just due to thinkorswim’s “.ts” file extension making your PC think it’s something other than TOS code. Have no fear, this is normal.

free-VWAP-indicator-thinkorswim2

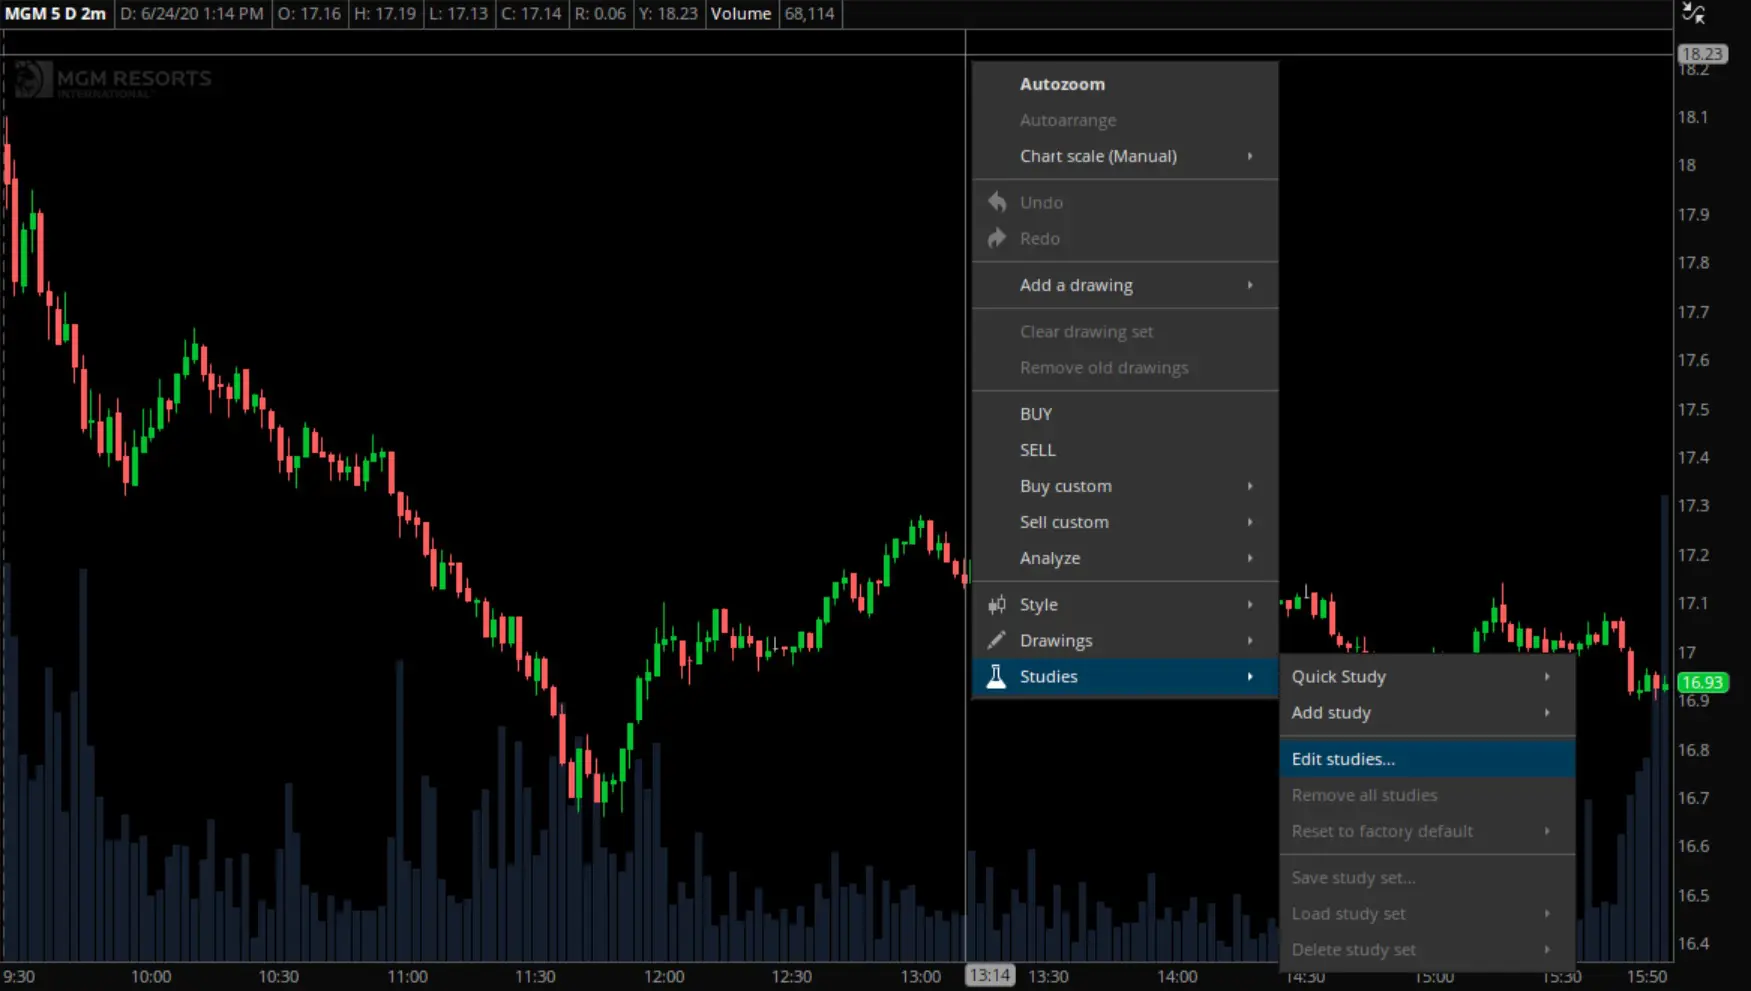
Step 3 – Open thinkorswim and pull up any blank chart. Right-click anywhere within the chart, mouse over “Studies”, and click “Edit Studies”. You can also use the key combination [Control+E] to access the Edit Studies window from any chart.

free-VWAP-indicator-thinkorswim3

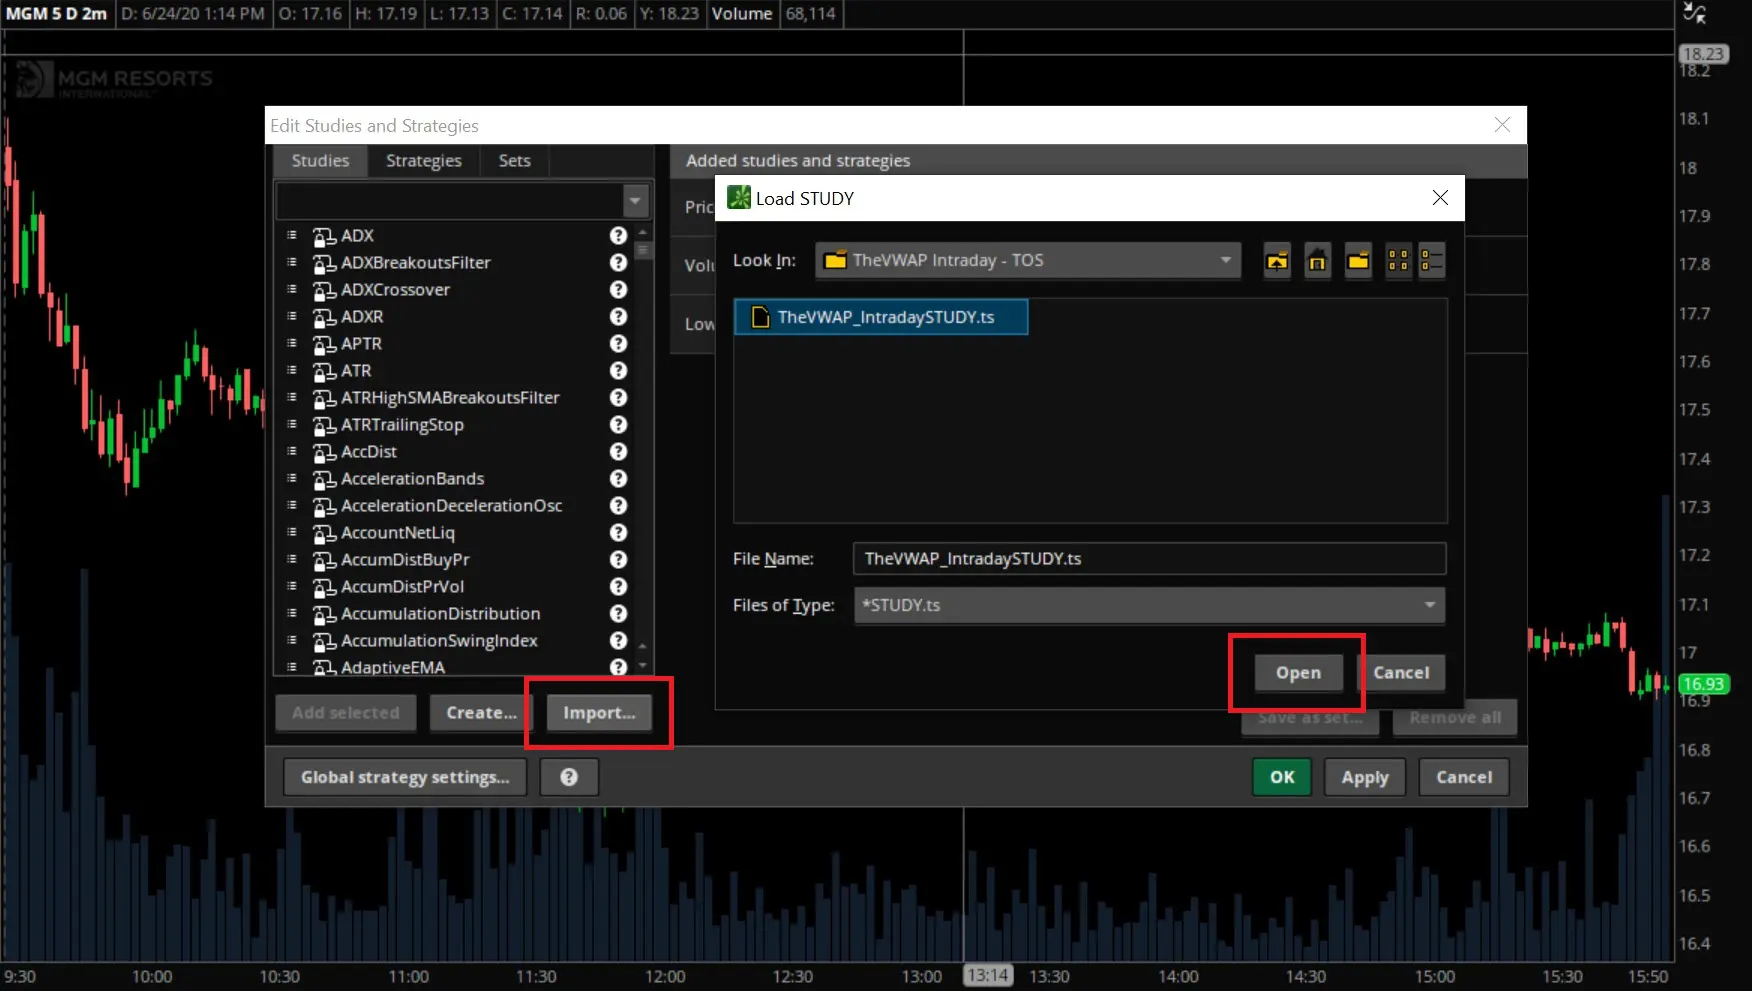
Step 4 – Click “Import…” to pull up the “Load STUDY” window and browse through the drop-down menu to locate the unzipped folder saved on your computer. Open the folder, highlight the study, and click “Open”.

free-VWAP-indicator-thinkorswim4

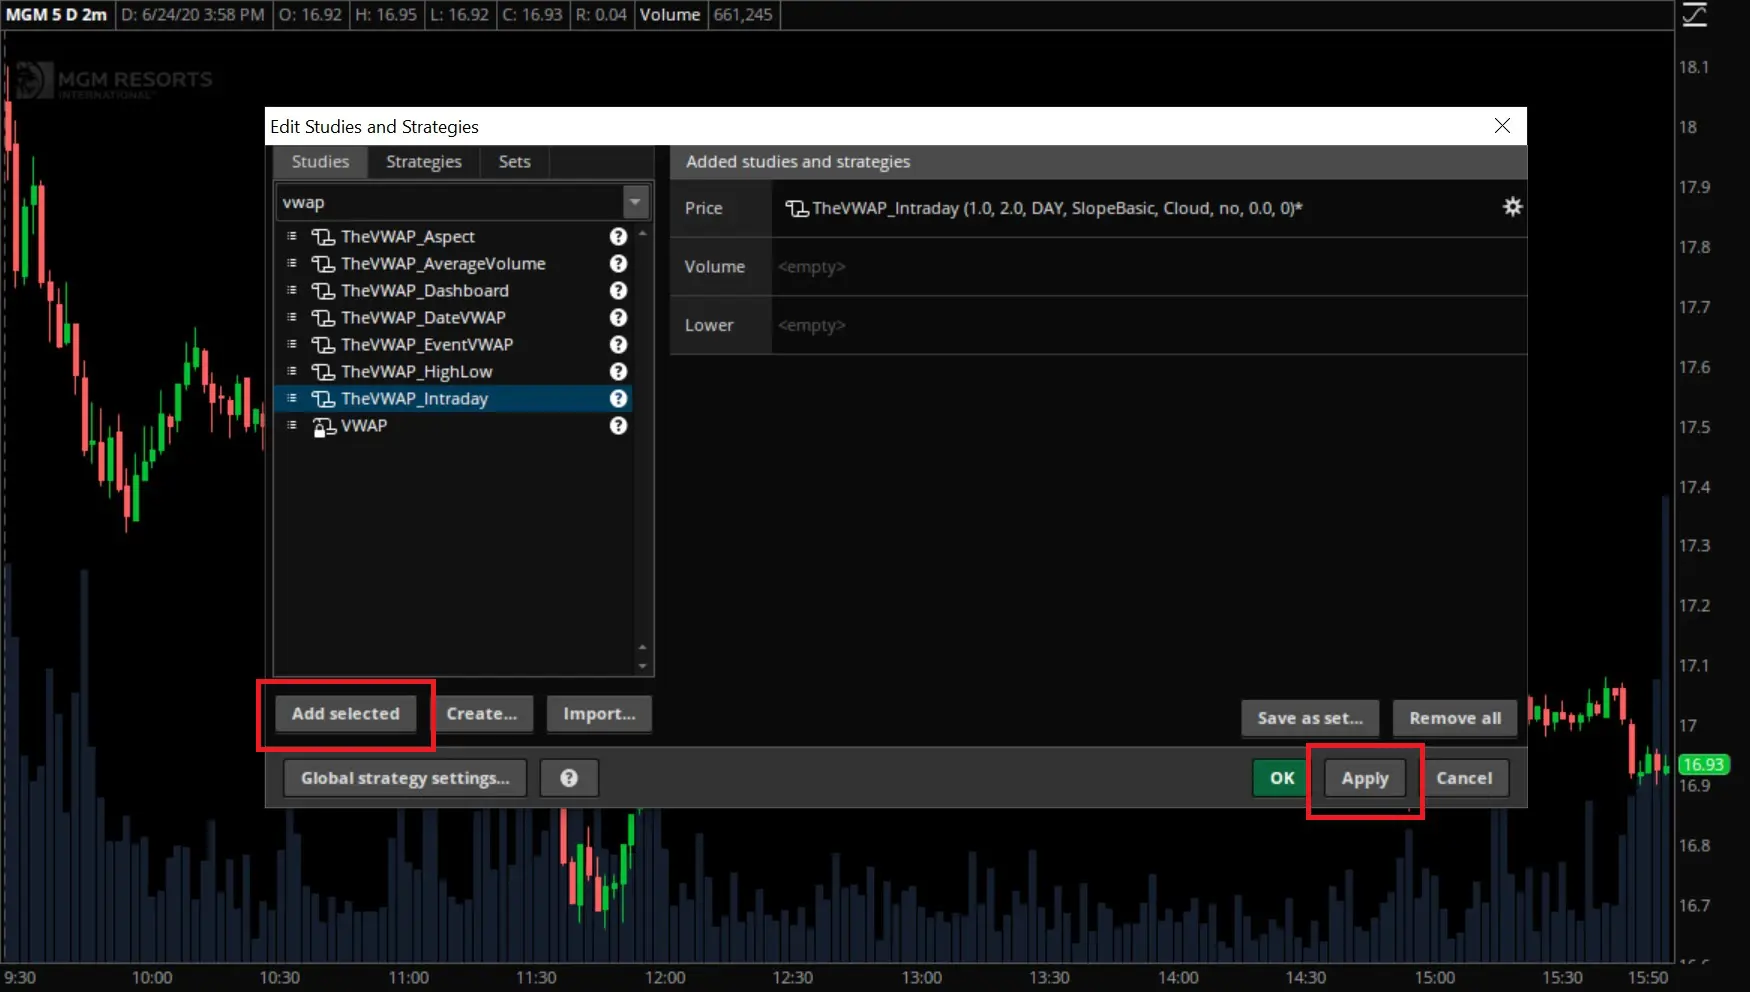
Step 5 – The study has now been loaded onto your platform but you still need to add it to your chart. Use the search bar on the left hand side to find the indicator you just imported — searching for “VWAP” is an easy, quick way to find all of our studies. Next, click “Add selected”, and then click “Apply”. You can also right-click the study and choose to rename it like we’ve done here.

free-VWAP-indicator-thinkorswim5

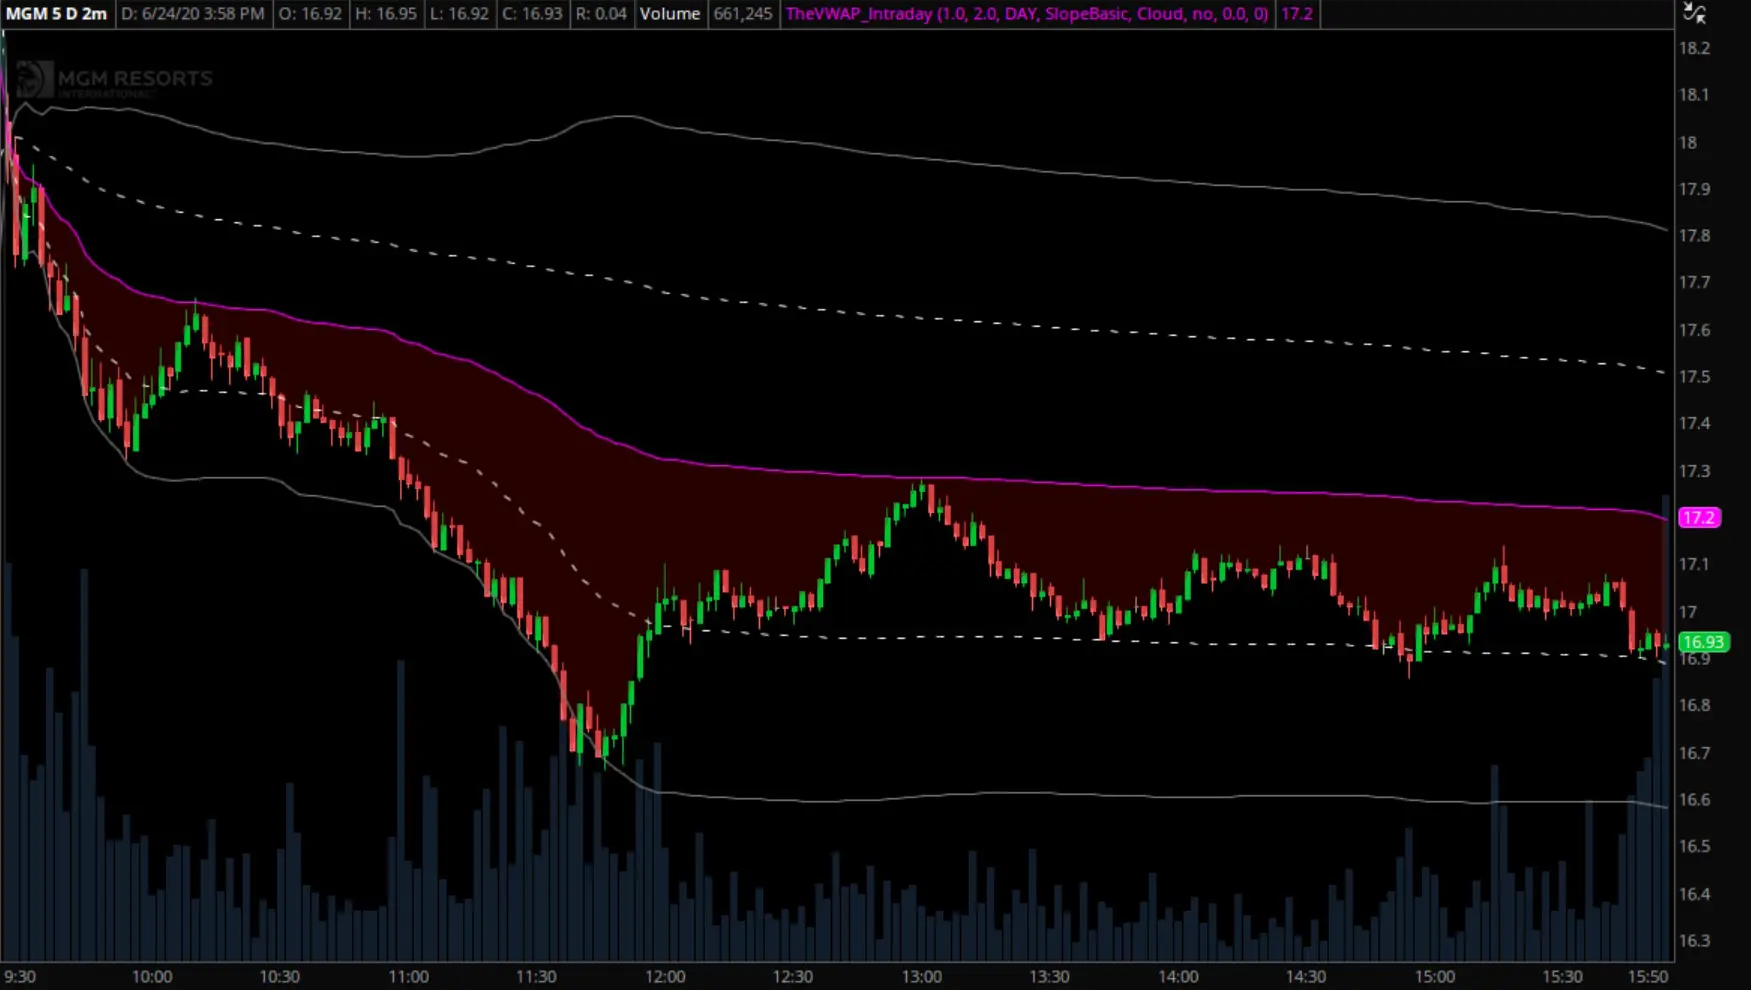
Step 6 – You should now see the indicator successfully added to your chart. Please be sure to read through the tutorial above to get familiar with all of its settings.

free-VWAP-indicator-thinkorswim6