Intraday for TradingView
Get the indicator and read through the tutorial provided below.
Indicator Tutorial
Click on the options below to read more about Intraday’s settings on TV.
Set to 1 and 2 by default, these inputs control the values of the plotted standard deviation bands on either side of VWAP. If both are set to 0, no deviation bands will be displayed.
Select your desired timeframe for the plotted VWAP. Here are the available options:
Day (default) — The option you’ll likely use most frequently. A standard intraday VWAP that resets at the beginning of each new trading session.
Week — Plots week-to-date VWAPs, using the first trading day of each week (or the leftmost point on the visible chart) as an anchor point.
Month — Plots month-to-date VWAPs, using the first trading day of each month (or the leftmost point on the visible chart) as an anchor point.
Change the display color for the plotted VWAP. Here are the available option:
SlopeBasic (default) — The color of VWAP will change dynamically based on the current slope of VWAP — one color for when ascending and one for when descending.
SlopeSignal — Similar to SlopeBasic, but a third color is added for periods of “neutral” slope.
Single — The color of VWAP will remain consistent regardless of the current slope value.
This setting controls the visual display of the clouds above/below VWAP. Here are the available options:
Cloud (default) — Displays clouds of two different colors — one for above VWAP and one for below.
Fast Lane — Displays clouds only in the space between the +/-1 and +/-2 deviation bands.
Cloud and Fast Lane — Combines the two options above, displaying four different colors.
This checkbox corresponds to a calculated slope value threshold and will highlight certain periods with coloring of the +/- 2 deviation bands. We discuss its use in VWAP On-Demand.
Plots additional bands surrounding the +/-1 deviation bands at a user-determined distance (expressed in deviations). We discuss their use in VWAP On-Demand.
Controls the display colors for the primary VWAP plot based on the configured settings. Here are the available options:
Color 0 — If VWAP Color is set to SlopeBasic or SlopeSignal, this option controls the color of VWAP during periods of positive slope.
Color 1 — If VWAP Color is set to SlopeBasic or SlopeSignal, this option controls the color of VWAP during periods of positive slope.
Color 2 — If VWAP Color is set to SlopeSignal, this option controls the color of VWAP during periods of neutral slope.
Color 3 — If VWAP Color is set to Single, this option controls the color of VWAP.
Controls the styling for the +1 and +2 deviation bands.
Controls the styling for the -1 and -2 deviation bands.
Controls the styling for tolerance bands (if enabled).
If clouds are enabled through Background Color Signal, these inputs control their styling.
Select which timeframes the indicator will not be displayed. This is primarily an intraday indicator, so you can likely disable the Days/Weeks/Months inputs at a minimum if Time Frame is set to “Day”.
Import Instructions
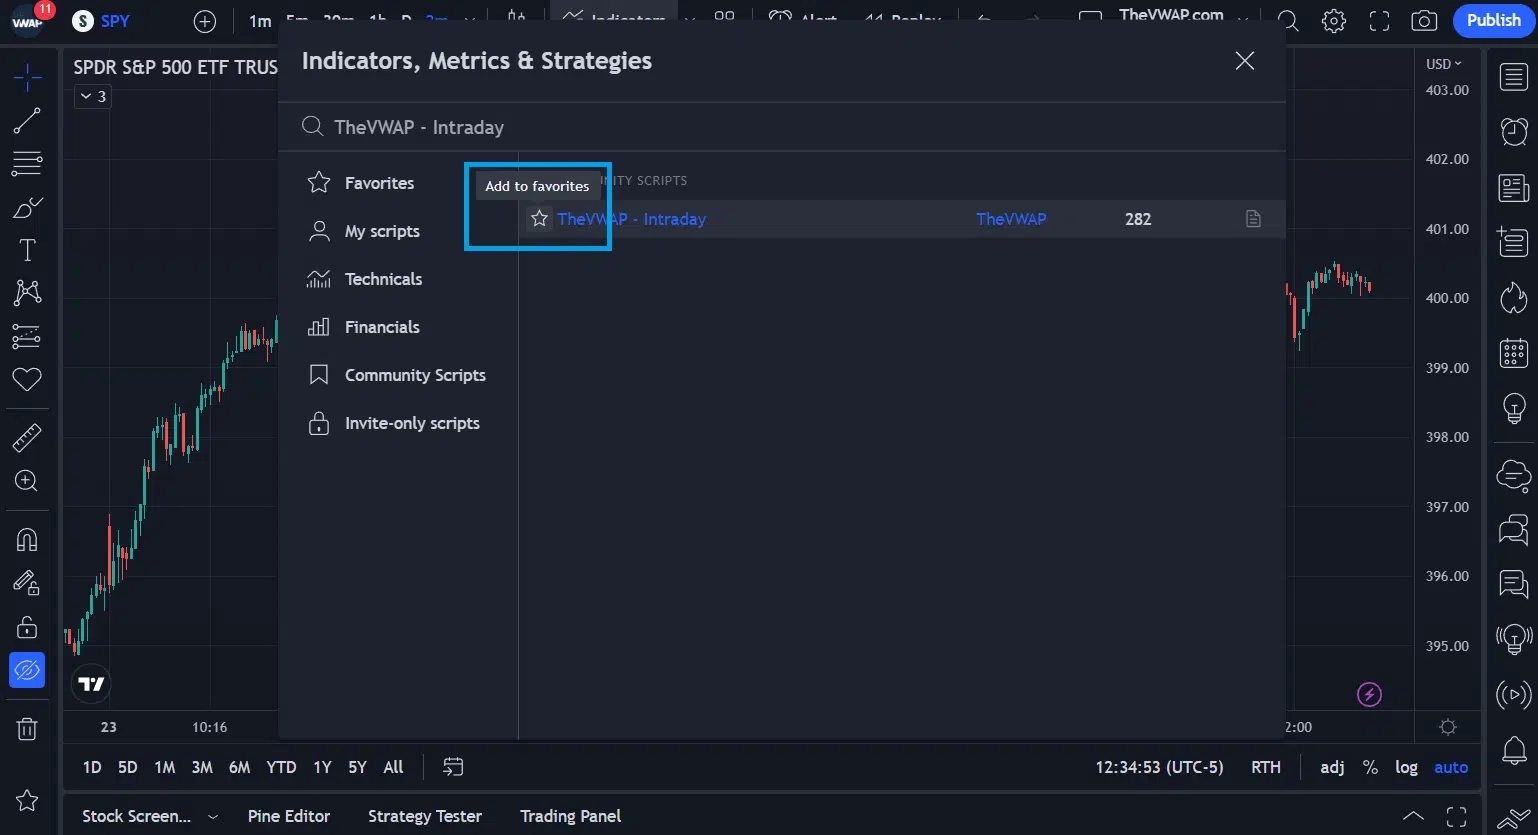
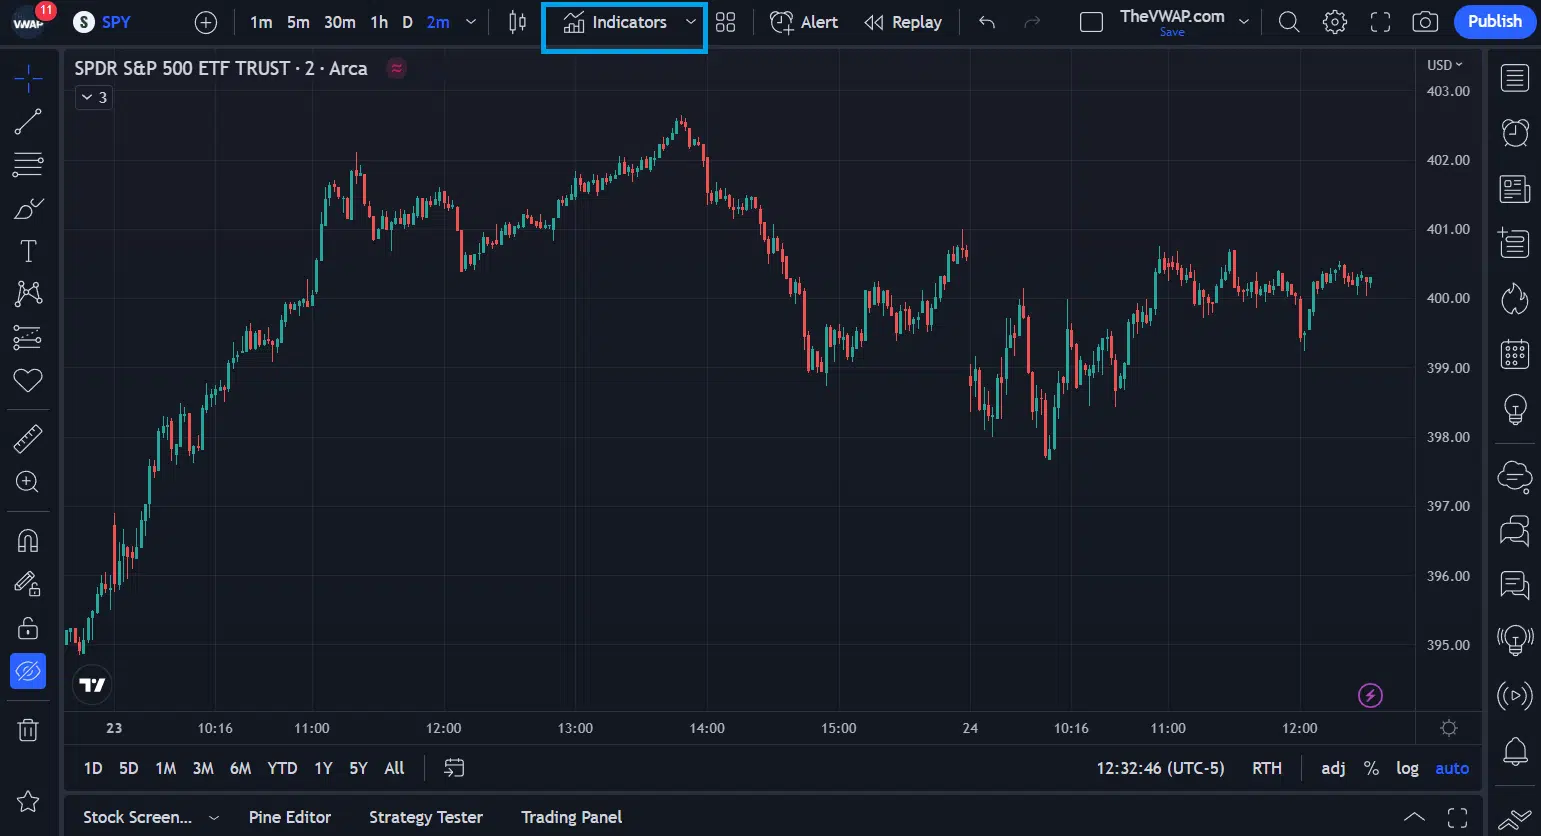
Step 1 – Intraday is available through TradingView’s public library. You can either access it using link provided above, or by clicking the “Indicators” tab at the top of any chart to bring up the Indicators & Strategies window.
Step 2 – Enter “TheVWAP – Intraday” in the search bar and click the indicator to add it to your chart, and then click the star to add it your favorites and make it easier to find in the future.