VWAP Strategy Overview
Our VWAP-focused framework incoporates often-overlooked concepts like standard deviation bands and anchored VWAPs to unlock its full potential.
Starting simple.
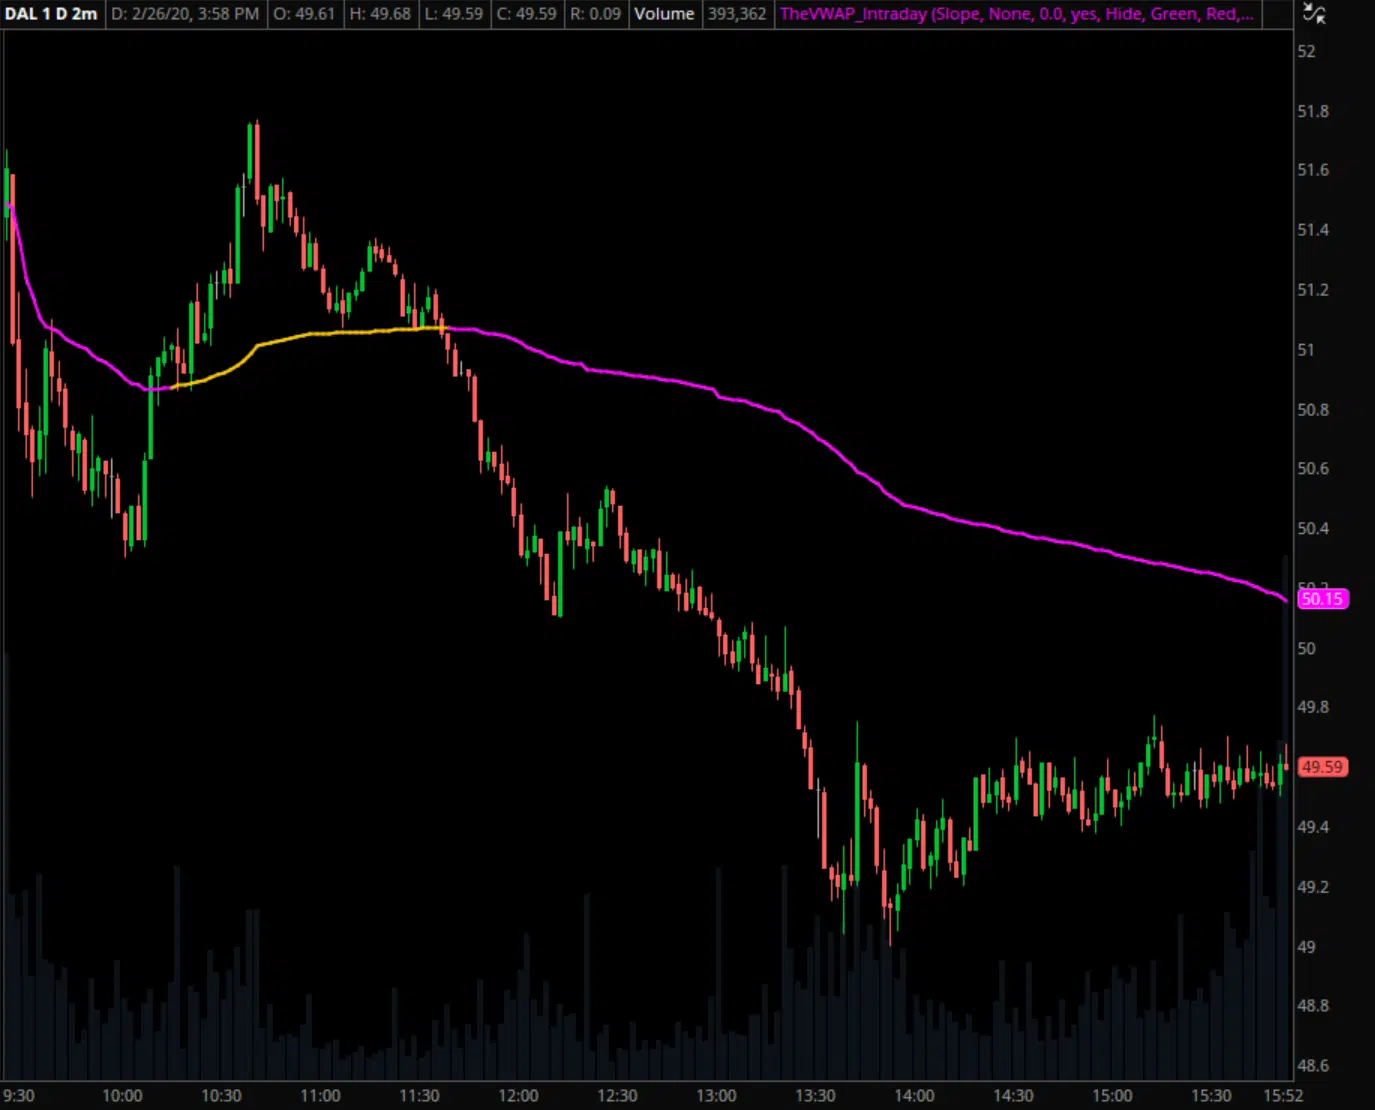
The most common application of VWAP is an intraday volume-weighted average price plotted from market open to market close, which is still awfully powerful on its own.
Both its cumulative calculation and the critical role it plays in institutional trading make it a driving force in market activity.
By maintaining the same initiation point and building upon itself over time, every share transacted gets factored in to its value. Put simply, it displays the market's true average price over the entirety of the trading session.
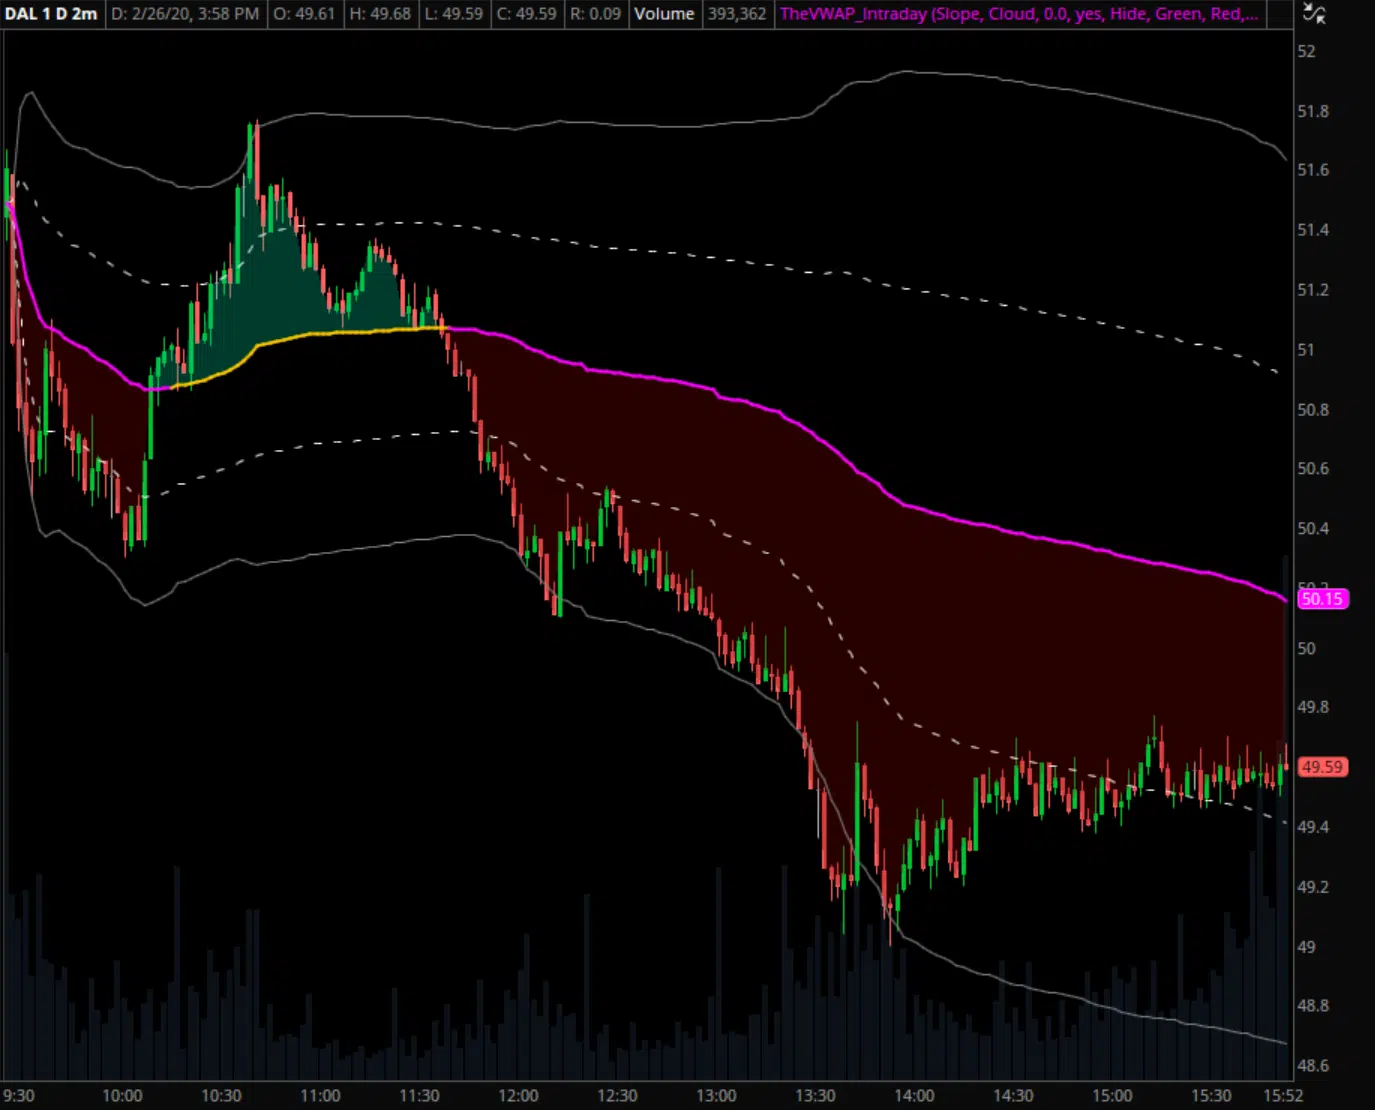
Bring in the bands.
Plotting standard deviation bands alongside VWAP creates a virtual grid system on our charts, segmenting price action into distinct zones and providing the ability to objective determine how far we're trading from the market's average price.
To do so, we use our free "Intraday" indicator.
Price tends to behave differently at varying distances, with VWAP and the deviation bands serving as the barriers separating those contrasting regions. The result? Areas of otherwise hidden support and resistance.
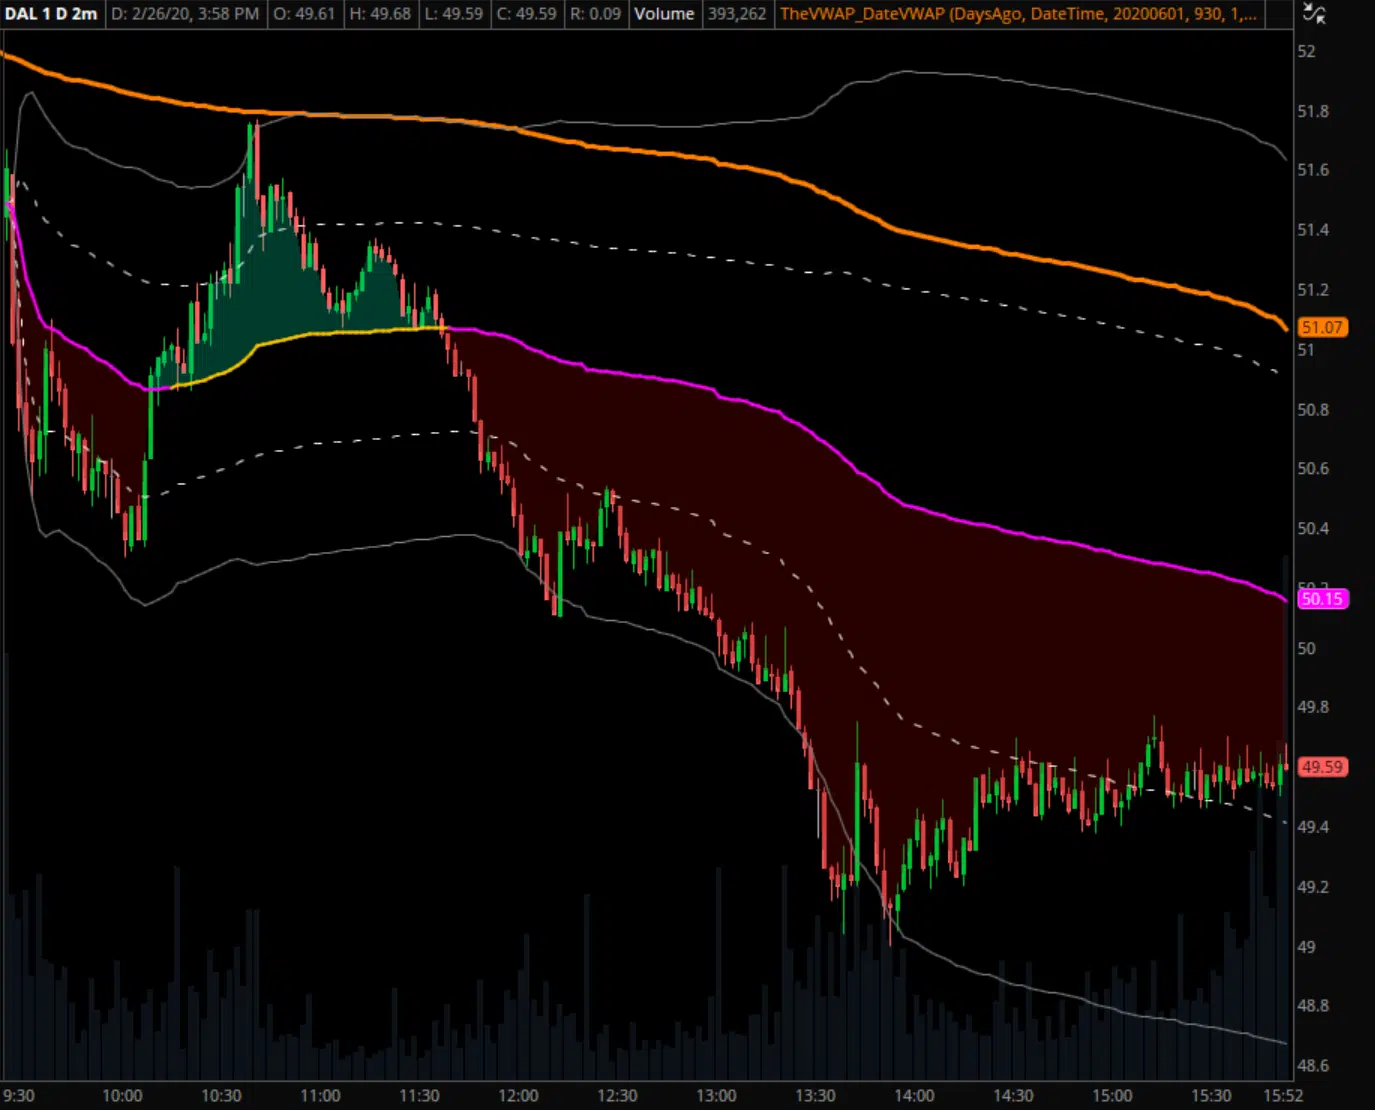
VWAP, but make it longer.
One of the biggest misunderstandings about VWAP is that it's only applicable on an intraday chart, but you should be anchoring volume-weighted averages to prior days as well.
We’re applying the same math — just altering it slightly to cumulatively track consecutive days without the daily reset.
Whether it's yesterday's open or a company's last earnings release, anchored VWAPs from notable events offer a window into market sentiment over a relevant time frame and add invaluable context to our charts.
Sorting through setups.
The combination of these concepts allow us to segment market behavior, make higher probability assumptions about upcoming chart movements, and identify areas of support and resistance that can be used for trade entries and exits.
From there we assess the quality of potential setups using a variety of metrics and methods, create trade plans, and define risk with initial stops and ongoing position management.
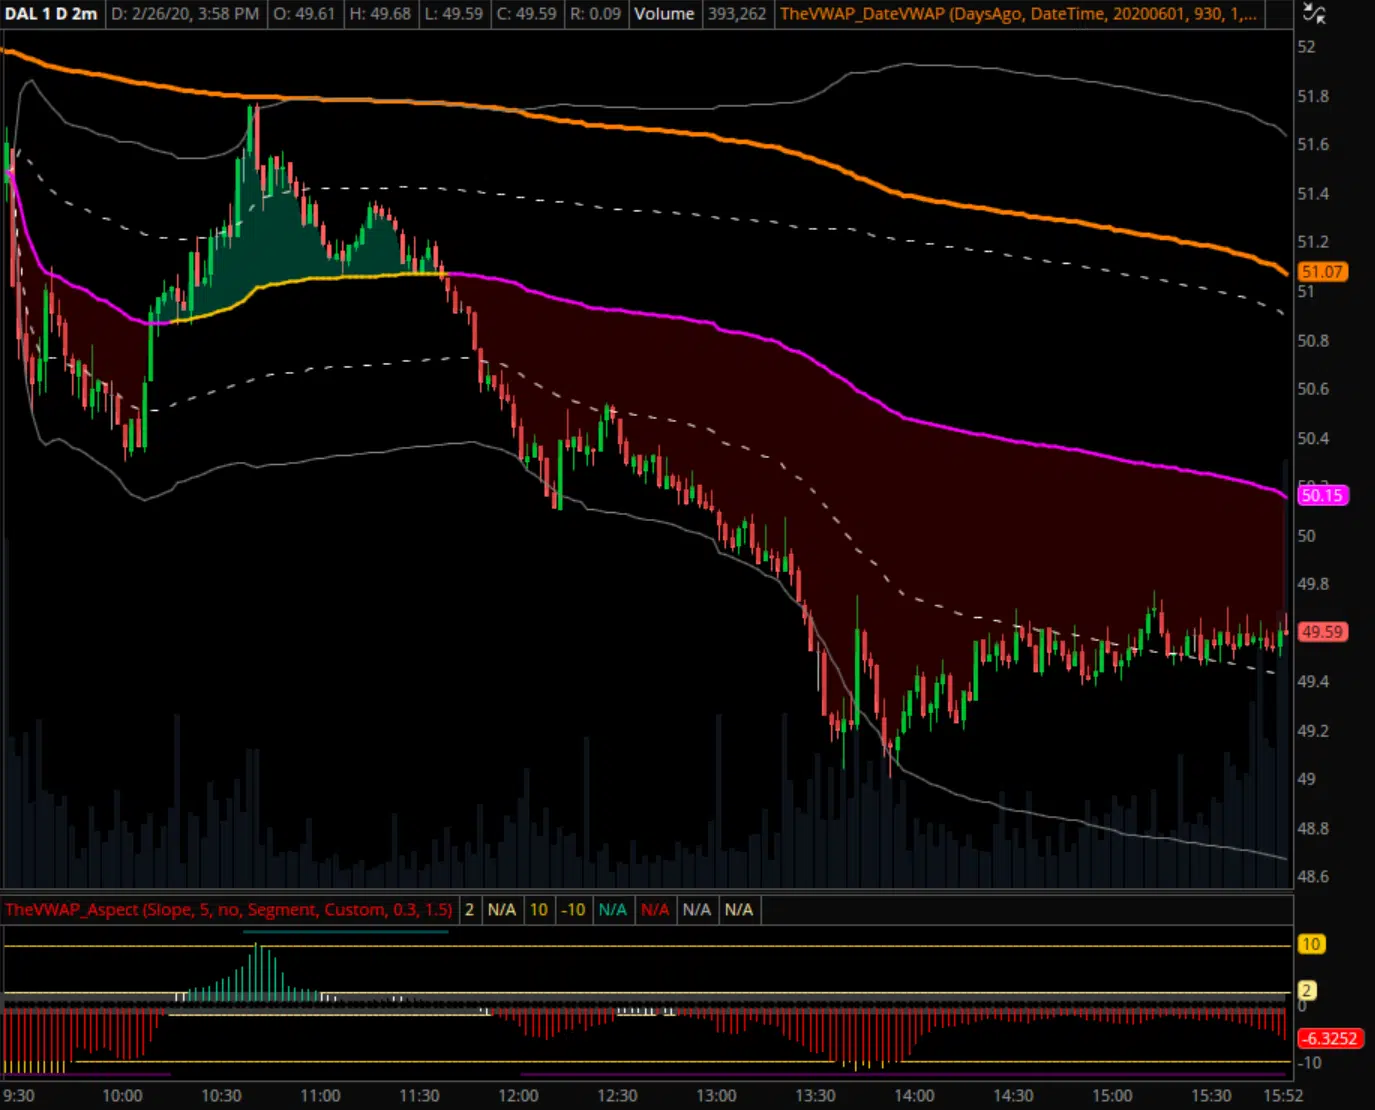
One of the metrics we track — the slope of VWAP — is shown here with one of our custom subgraph indicators.
Flexibility
The impact of VWAP — and as a result our strategy — is not limited to one particular market type. Its widespread
use by institutional traders makes it effective wherever they're conducting transactions, which is ... basically
everywhere.
As long as there's sufficient volume, VWAP should play a role. To be specific, we have members that currently
apply our framework to:
- Futures — ES, NQ, CL, GC, currency Futures, etc.
- Large, mid, and small cap stocks
- Options trading
- Cryptocurrency
Click here to view more chart examples of the markets listed above.
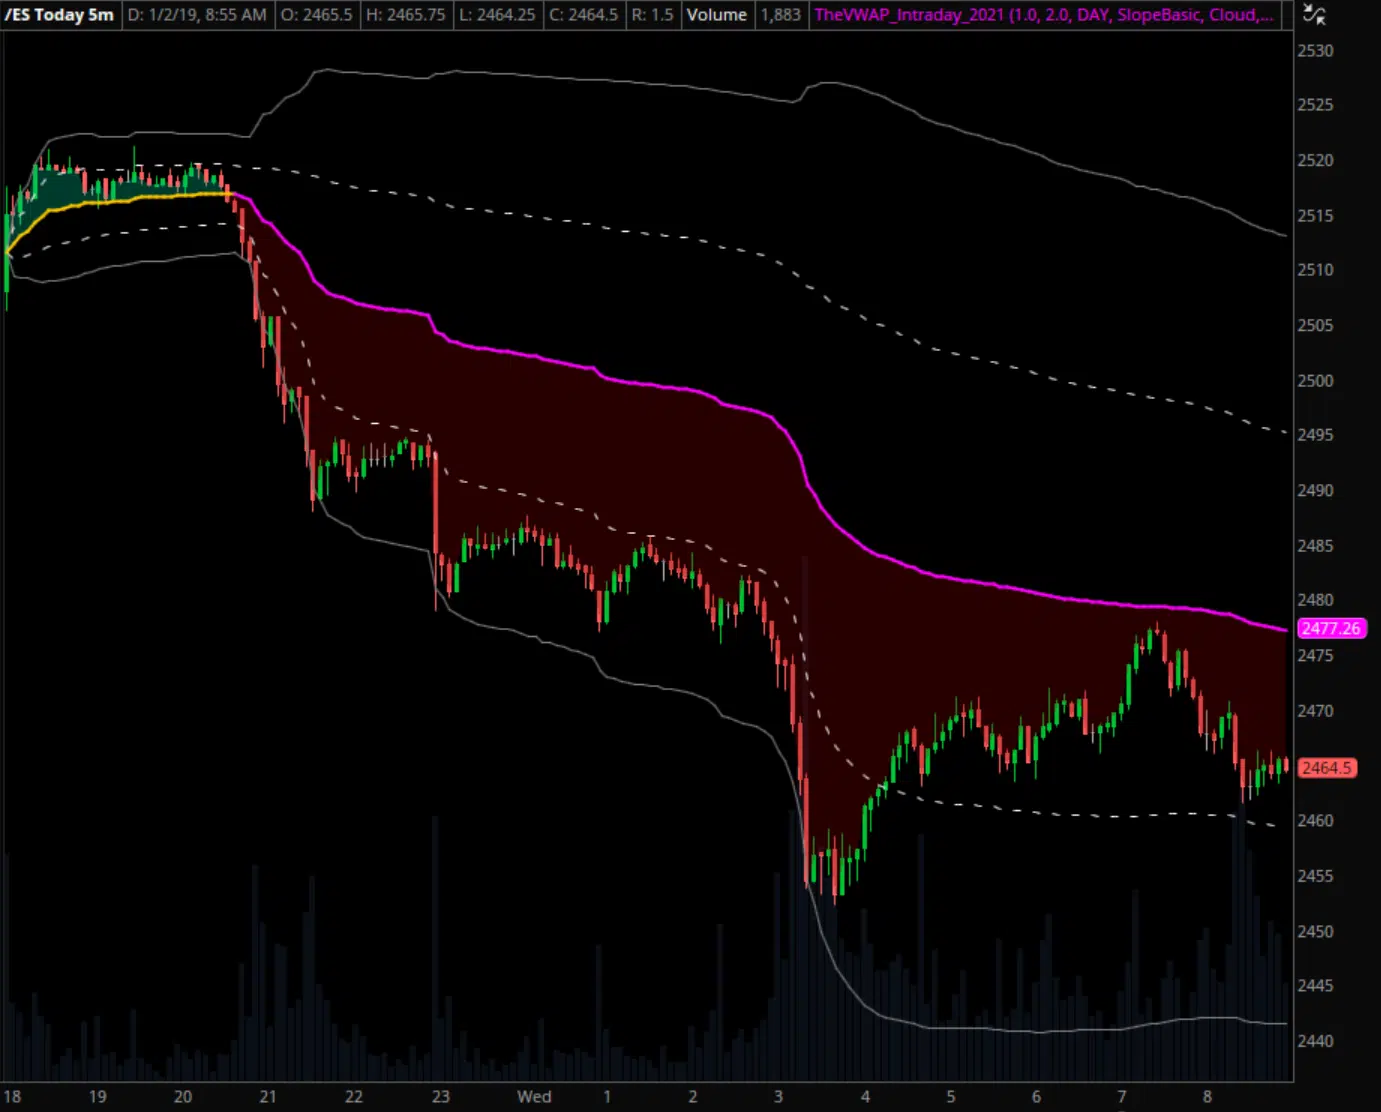
Intraday chart of the E-mini S&P 500 (/ES) from January 1st, 2019 with intraday VWAP and standard deviation bands applied.
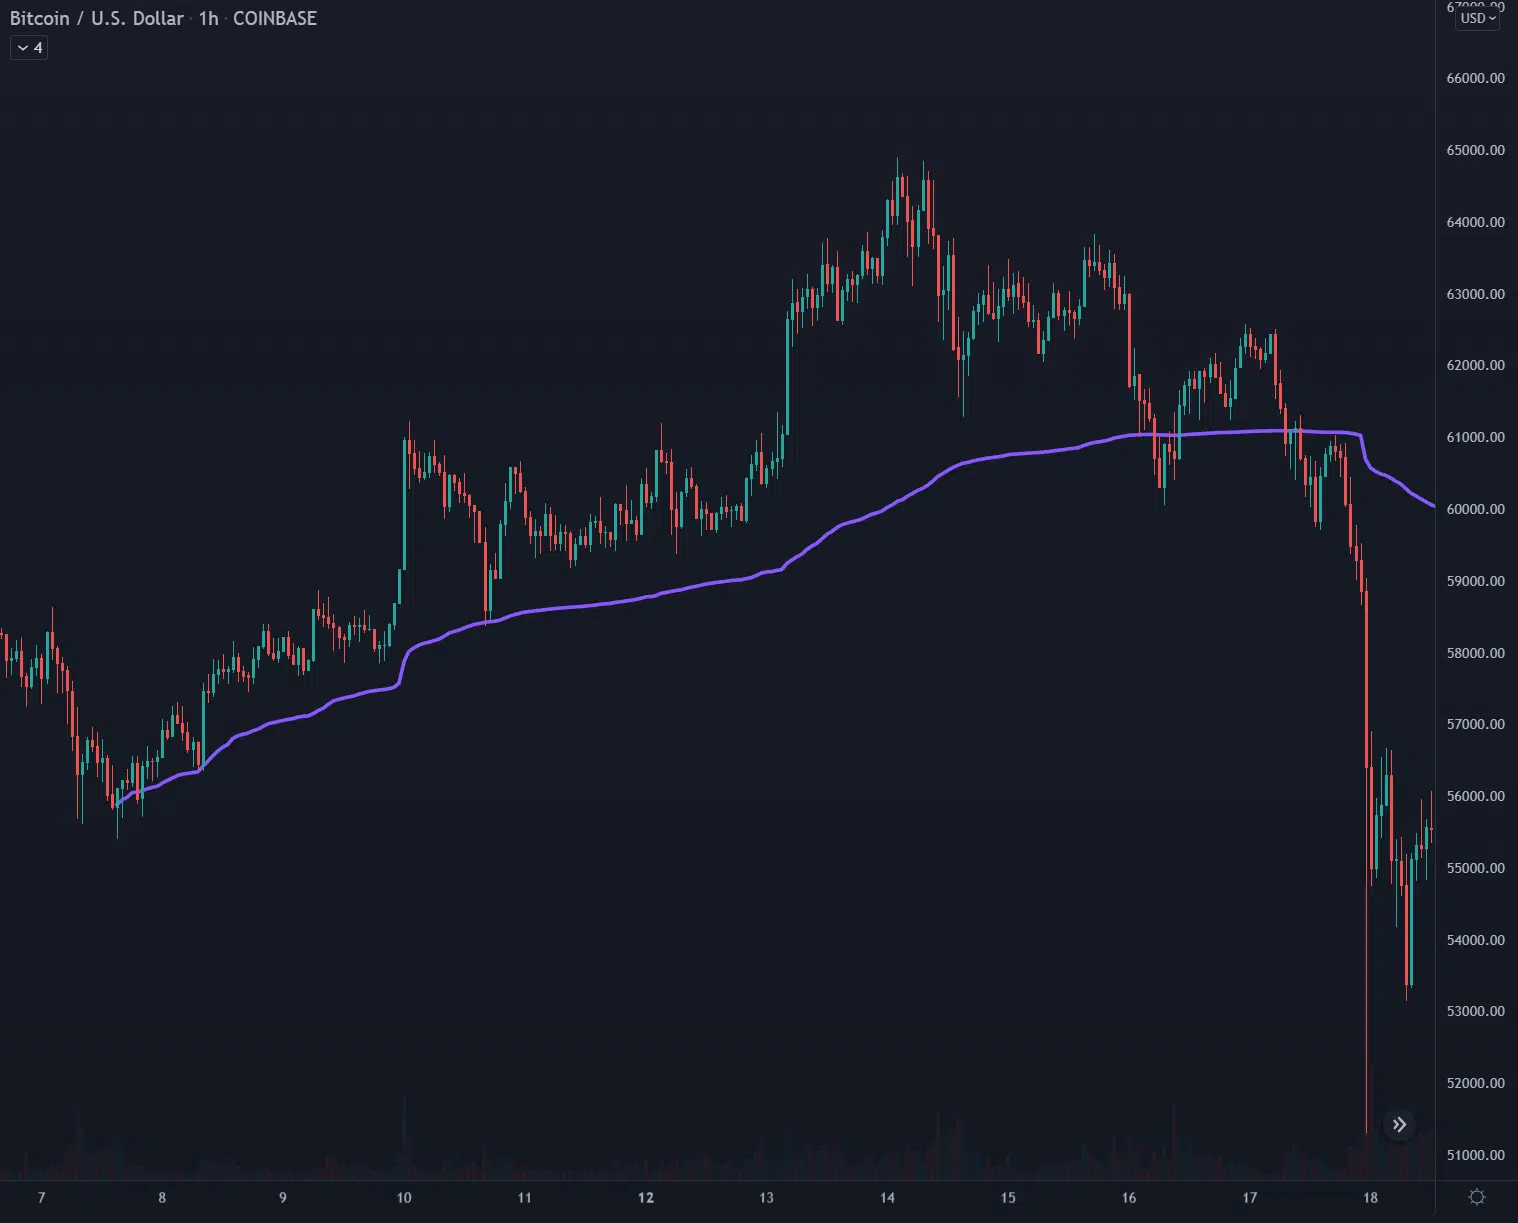
Hourly chart of Bitcoin from April 2021, with a VWAP anchored to a recent low from April 7th prior to a one-week uptrend.
Versatility
One of the most clear-cut benefits of VWAP and its associated standard deviations bands may be as support and
resistance levels, but that's not the only role they play in our approach.
While we do utilize them for trade entries, initial/ongoing risk management, and eventual exits, we also rely on
these tools to characterize and contextualize chart behavior, interpret past and current price action, and make
educated guesses about what is most likely to happen next. We incorporate additional concepts like slope and
longer-term anchored VWAPs to help accomplish these objectives as well.
This splits our approach into two separate but related components: strategic assessment and tactical
implementation. Before deciding where, when, and how to enter or exit a trade, it's crucial that you first
determine if the chart you’re looking at is worth trading at all.
Adaptability
The framework we implement is not biased in either direction. We teach four primary trade types — two for trend
continutation and two for countertrend reversion — that each have both long and short applications. The prevailing
market conditions at any given moment will often dictate which trade types are most likely to yield success, and
having the ability to modify your plan of attack accordingly is crucial to long-term success.
So while the tactics you employ (trade type, typical hold time, position sizing, entry/exit criteria, etc) may
change in response to different environments, the underlying concepts that make up our strategy remain in tact.
We continue to assess charts using the same metholodology, and the result of that assessment helps determine how
we proceed.
Click here to view more examples of our approach dating back as
far as 2010, demonstrating the longevity of VWAP and its ability to adapt over time.
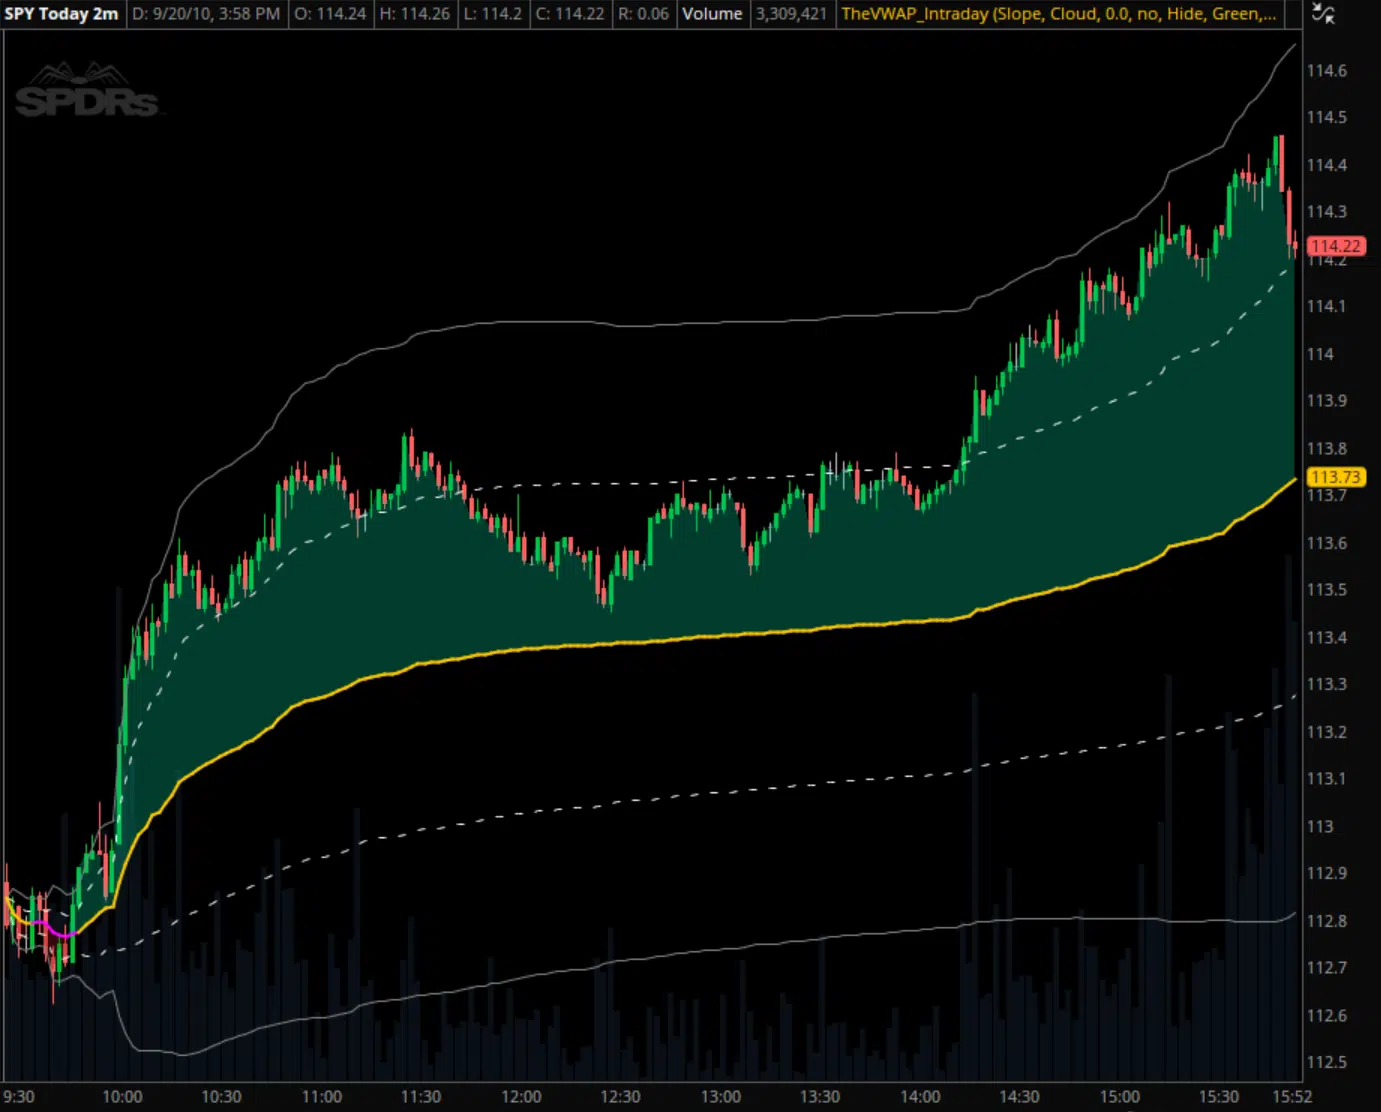
Intraday chart of SPY from September 20th, 2010 with intraday VWAP and standard deviation bands applied.
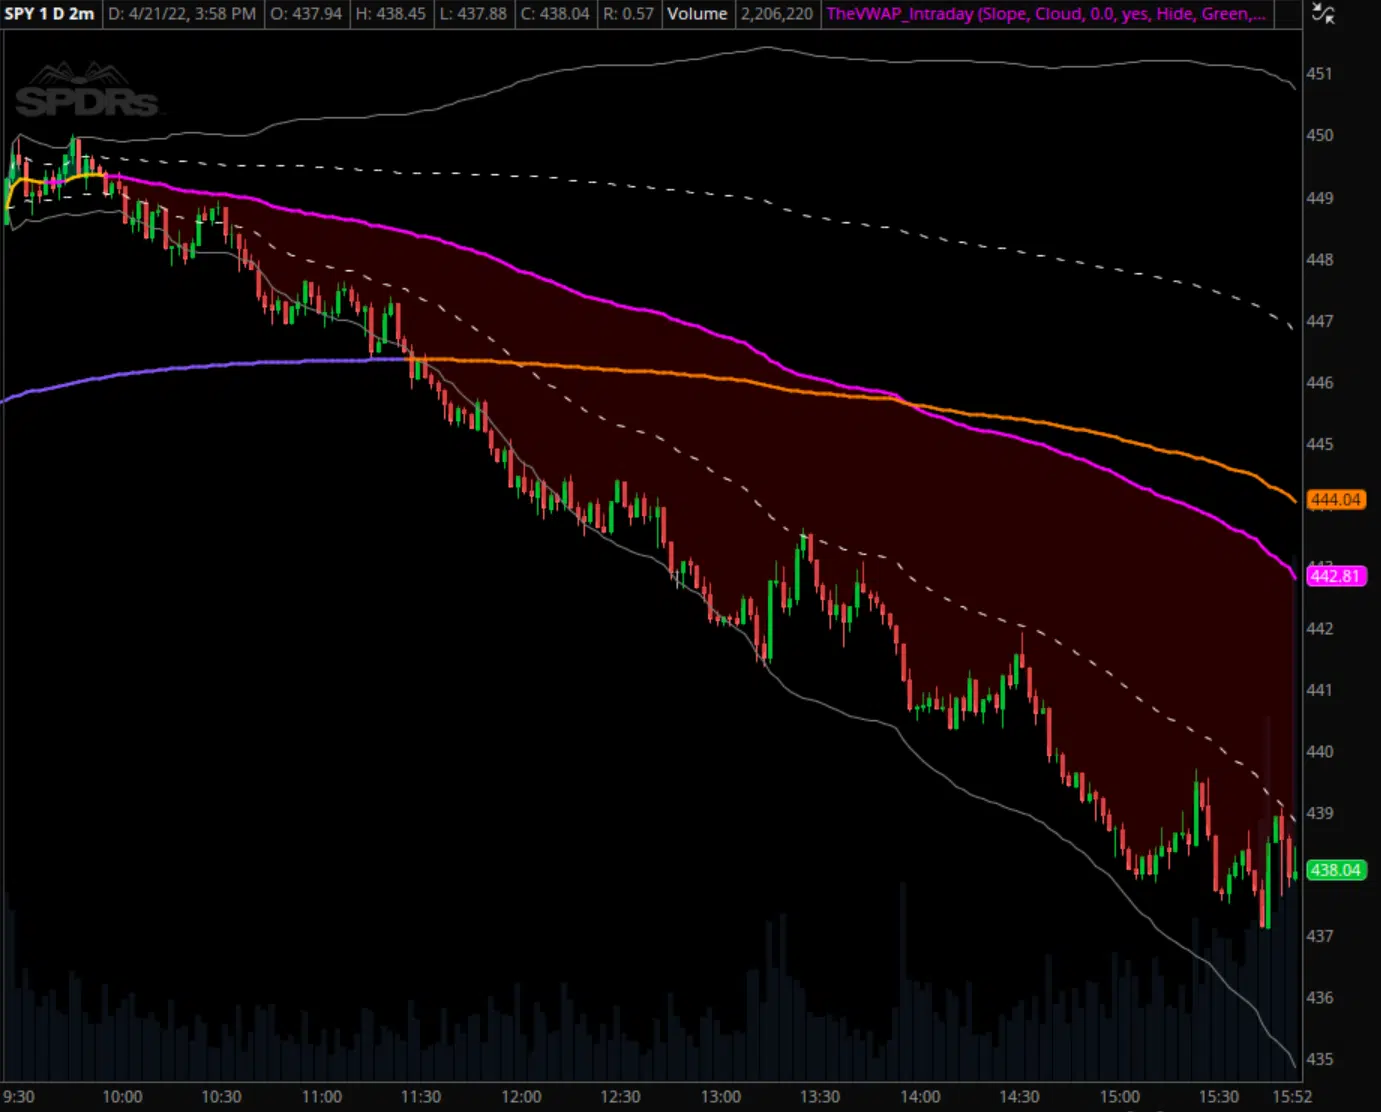
Intraday chart of SPY from April 21st, 2022 with intraday VWAP, standard deviation bands, and the prior day's VWAP applied.
Hidden Support and Resistance?
We don't expect you to just take our word for it, so here's some more chart examples.
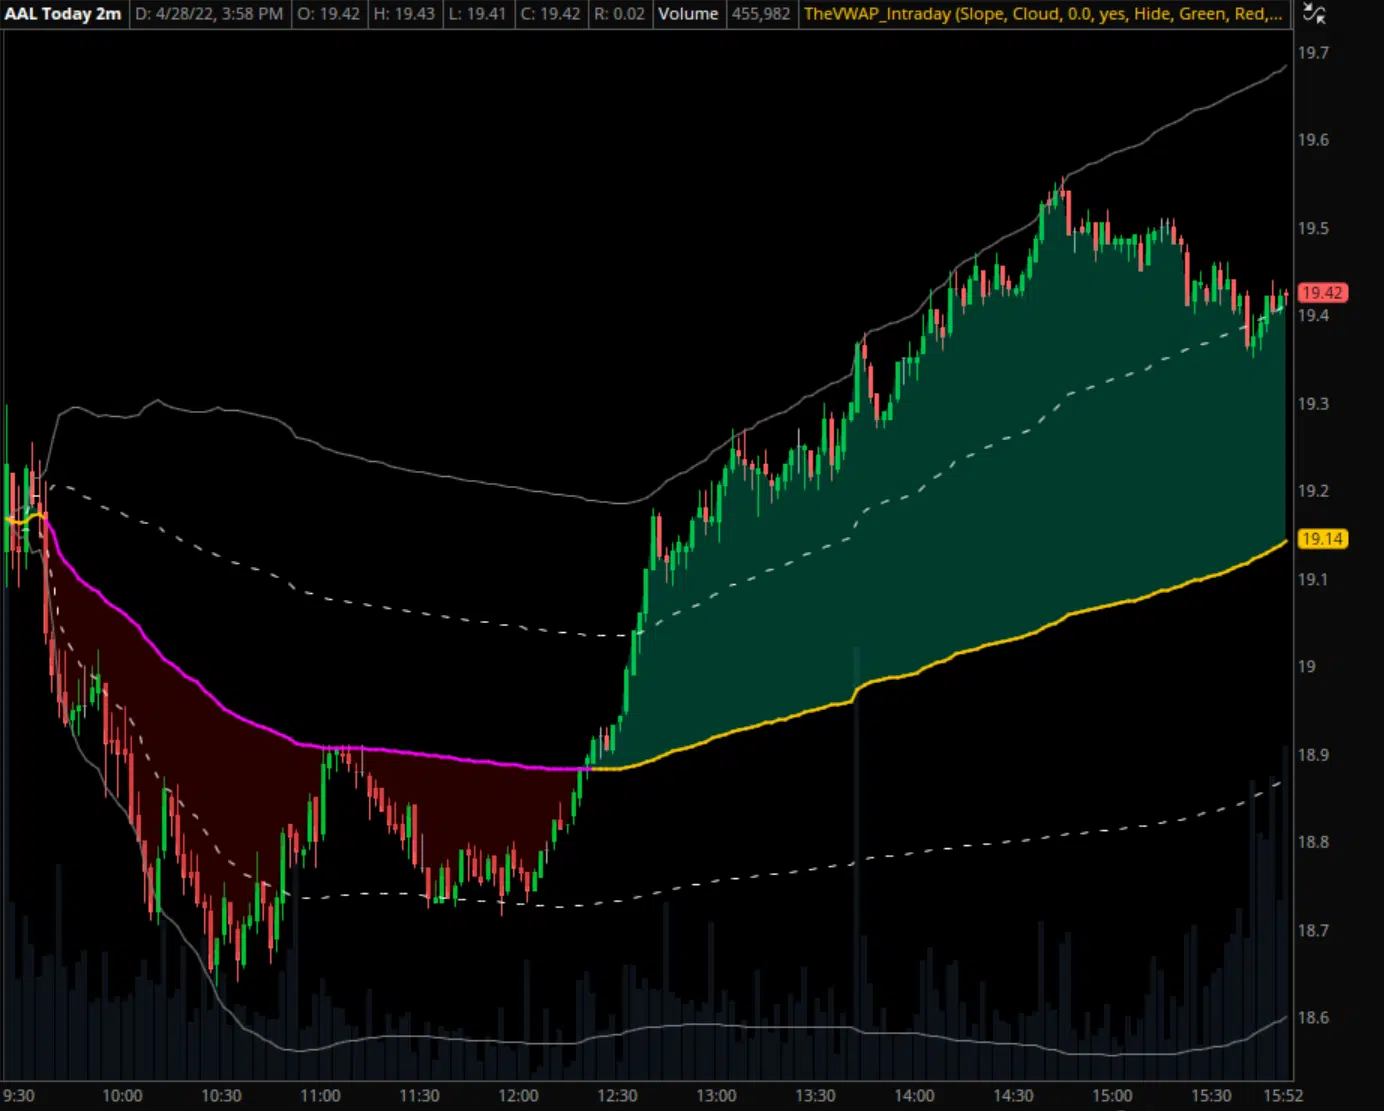
AAL 4/28/22 — Intraday VWAP with deviation bands
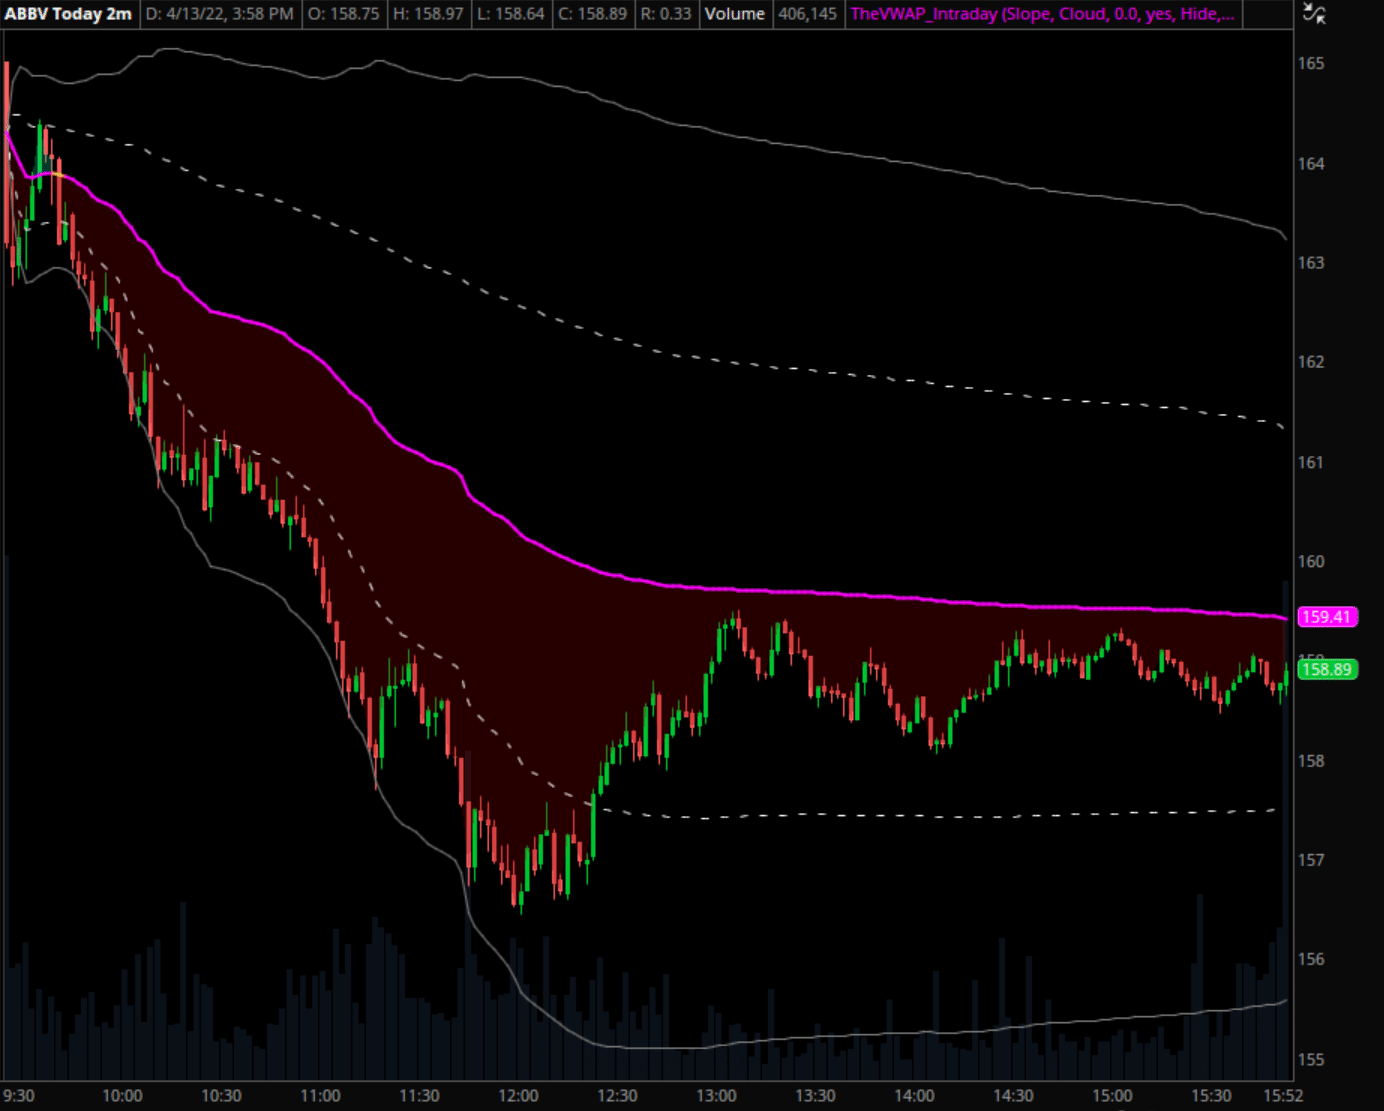
ABBV 4/13/22 — Intraday VWAP with deviation bands
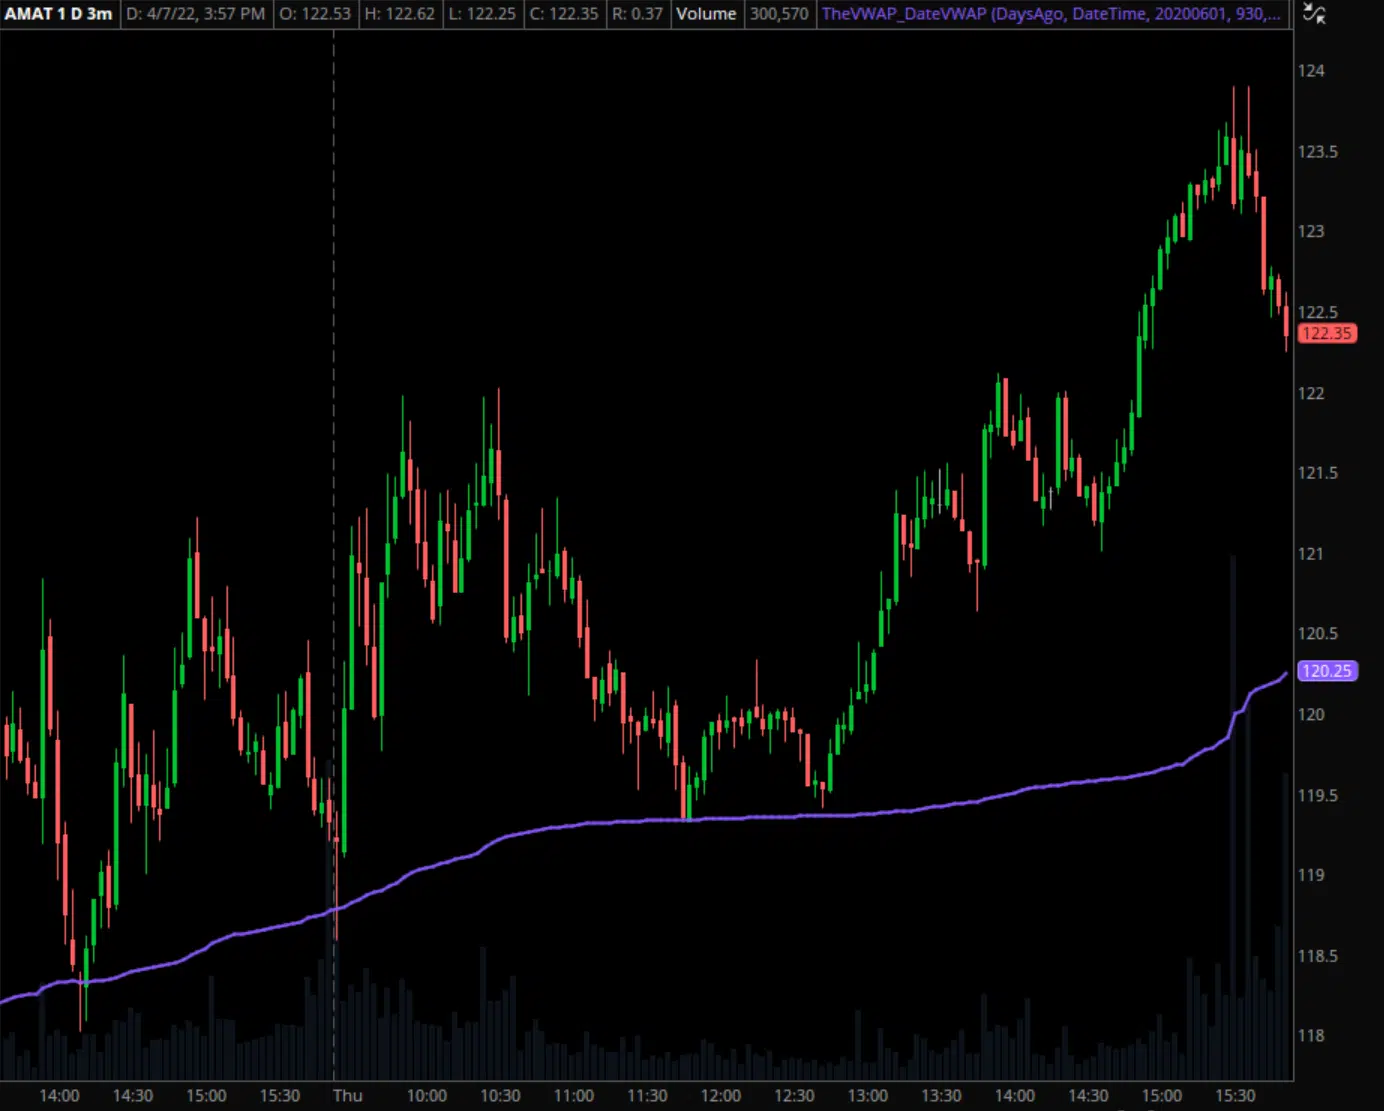
AMAT 4/7/22 — Prior day's VWAP
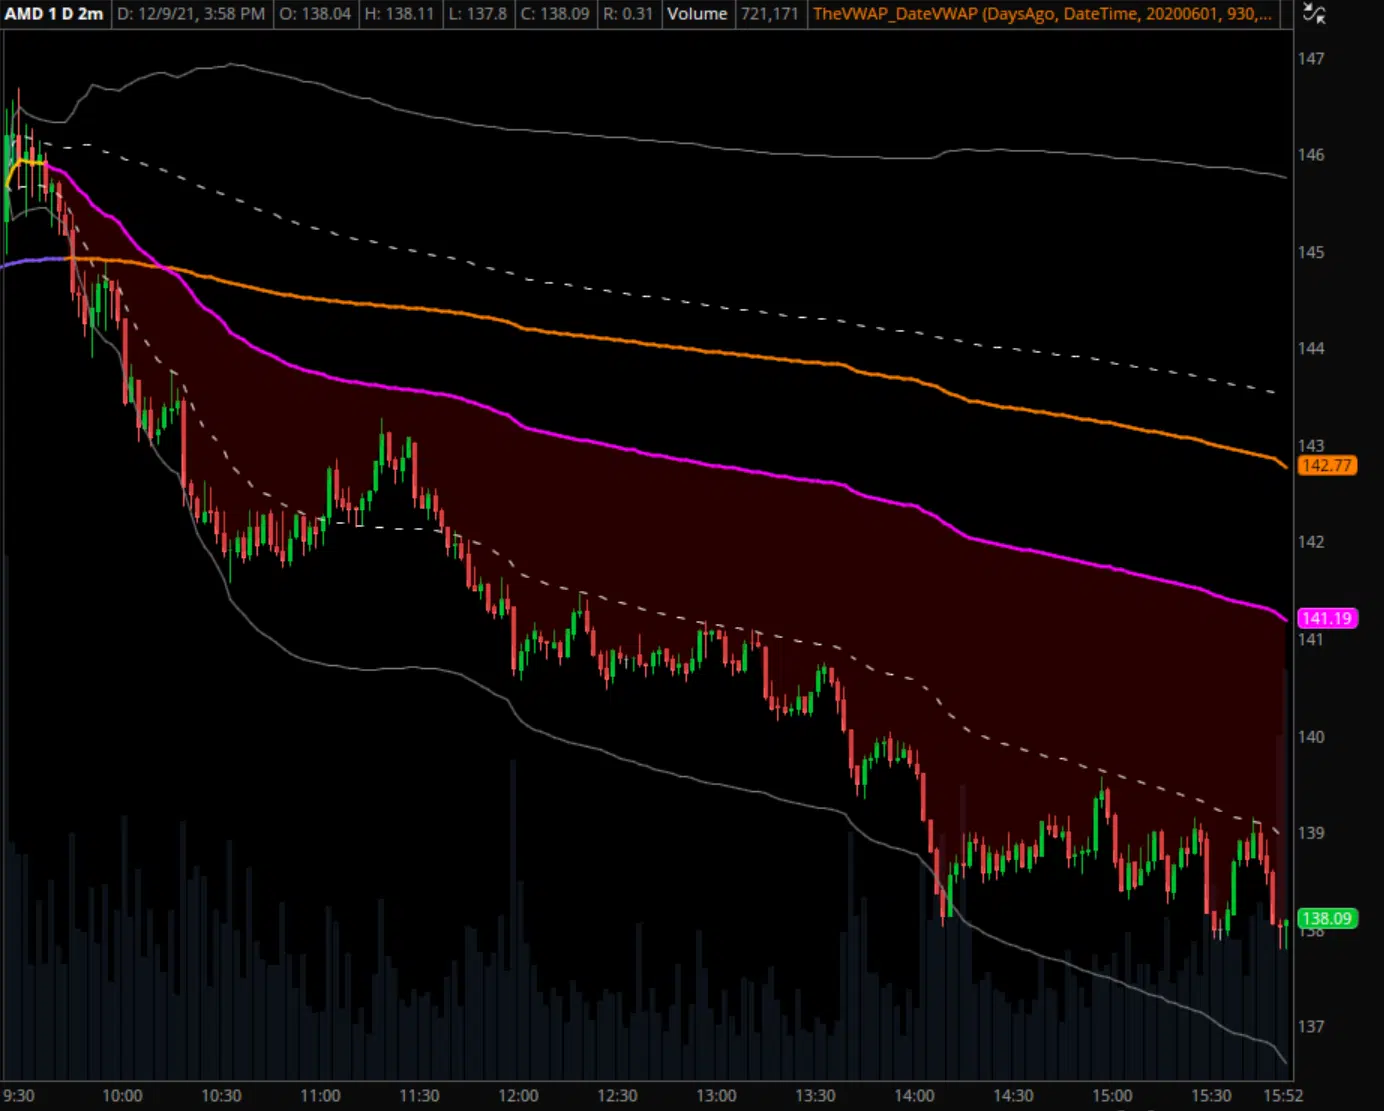
AMD 12/9/21 — Intraday VWAP with dev bands + prior day's VWAP
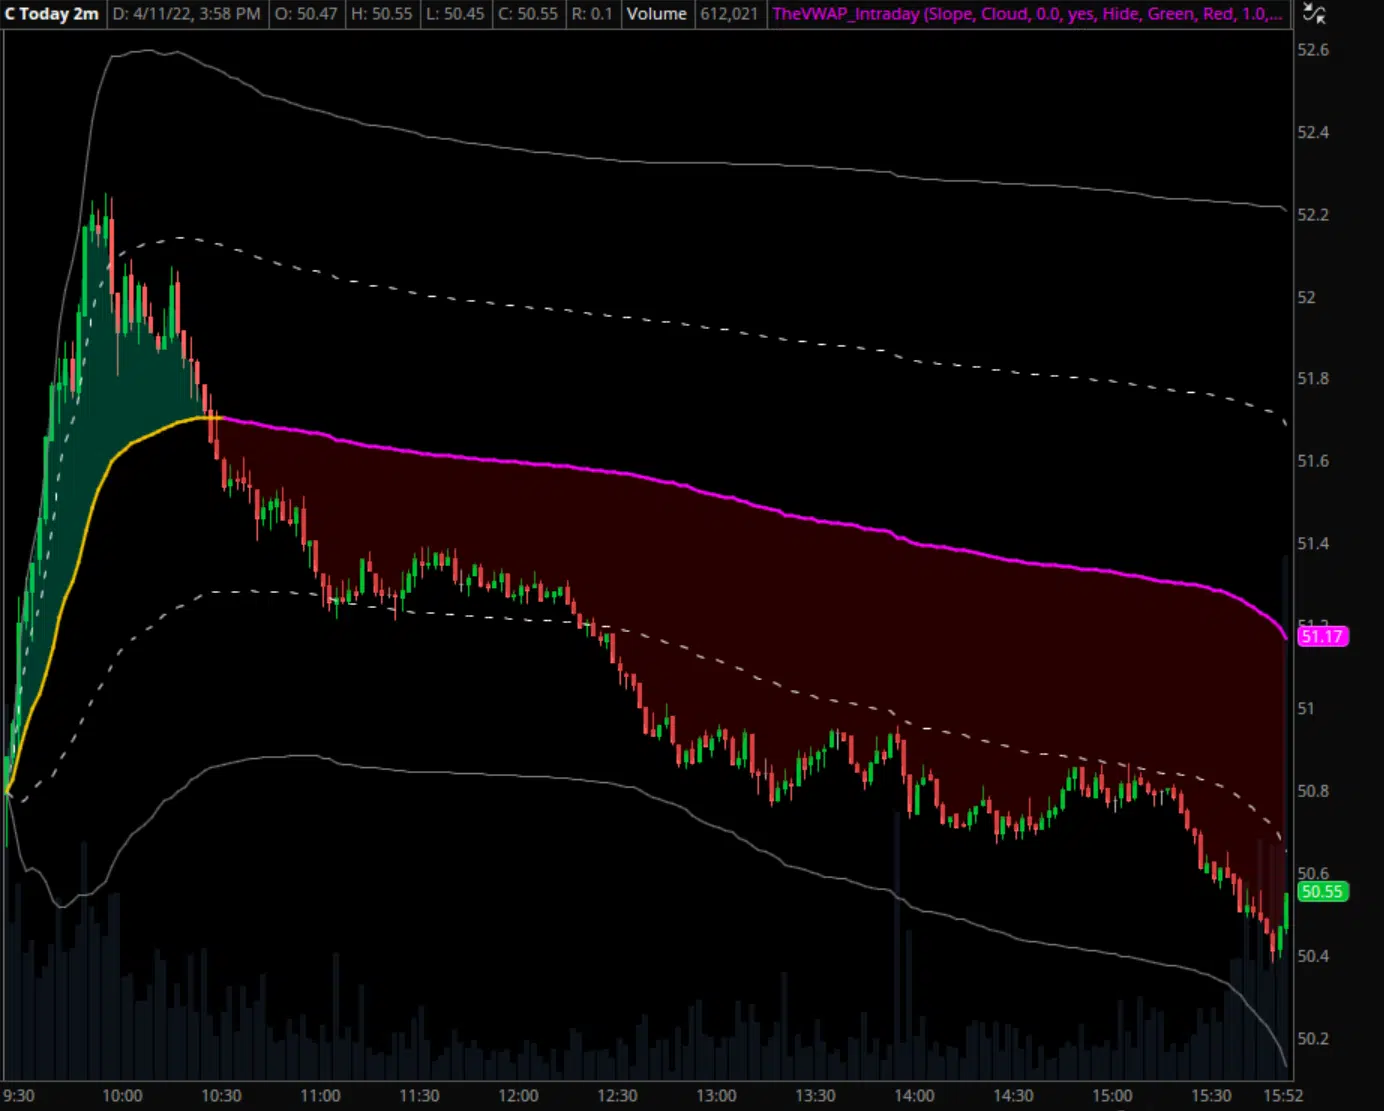
C 4/11/22 — Intraday VWAP with deviation bands
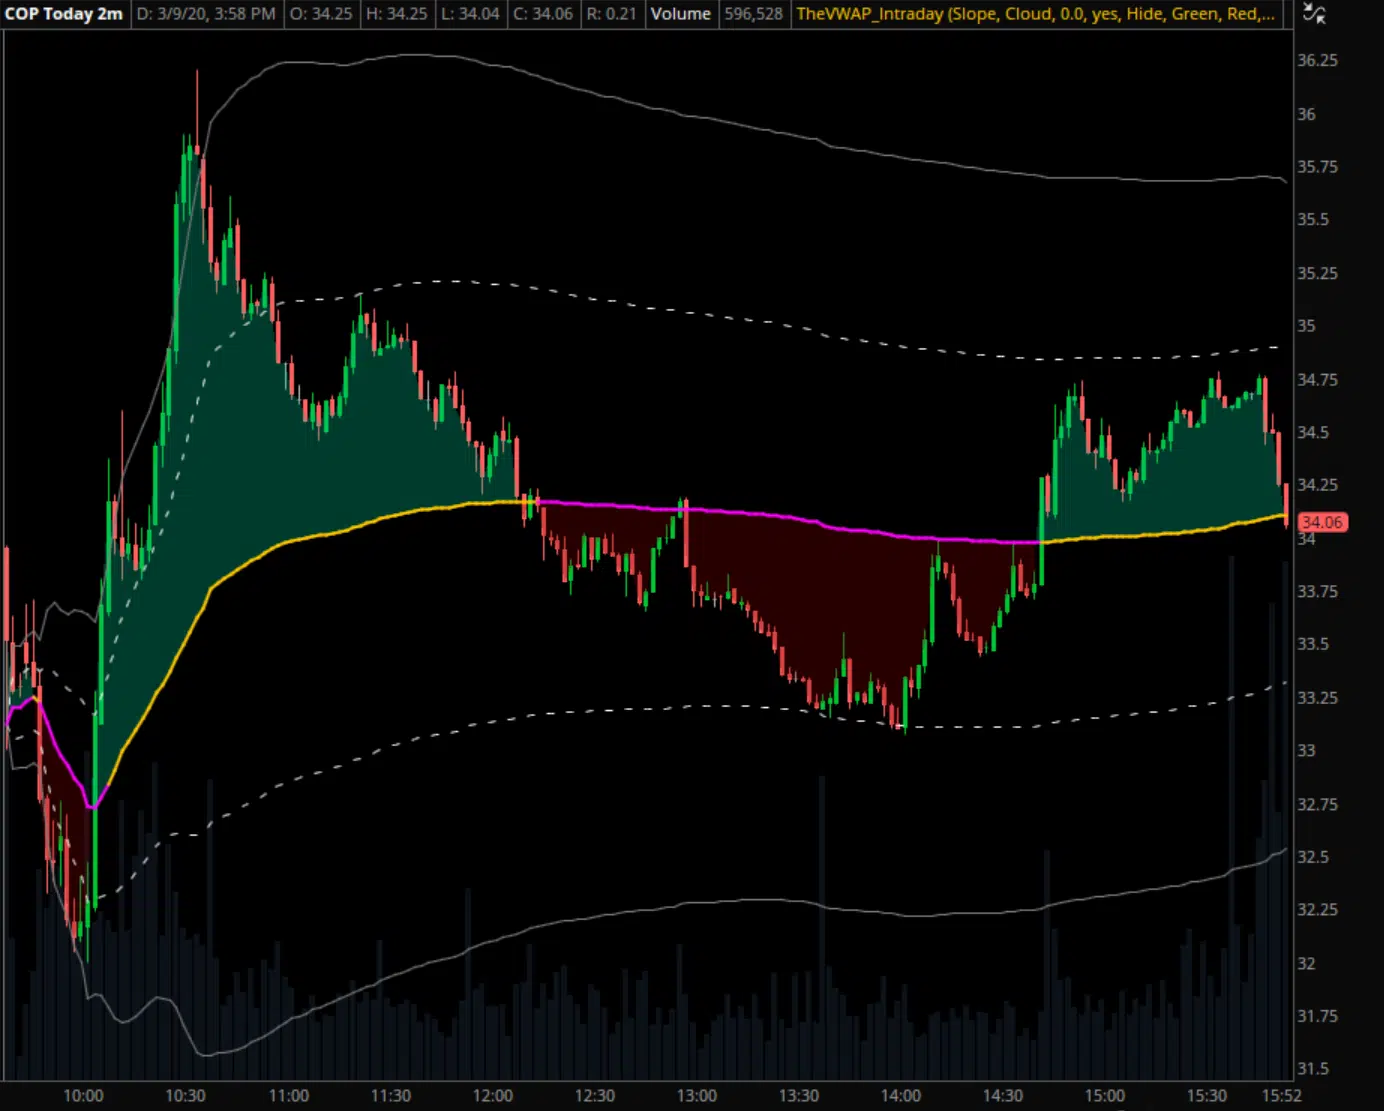
COP 3/9/20 — Intraday VWAP with deviation bands
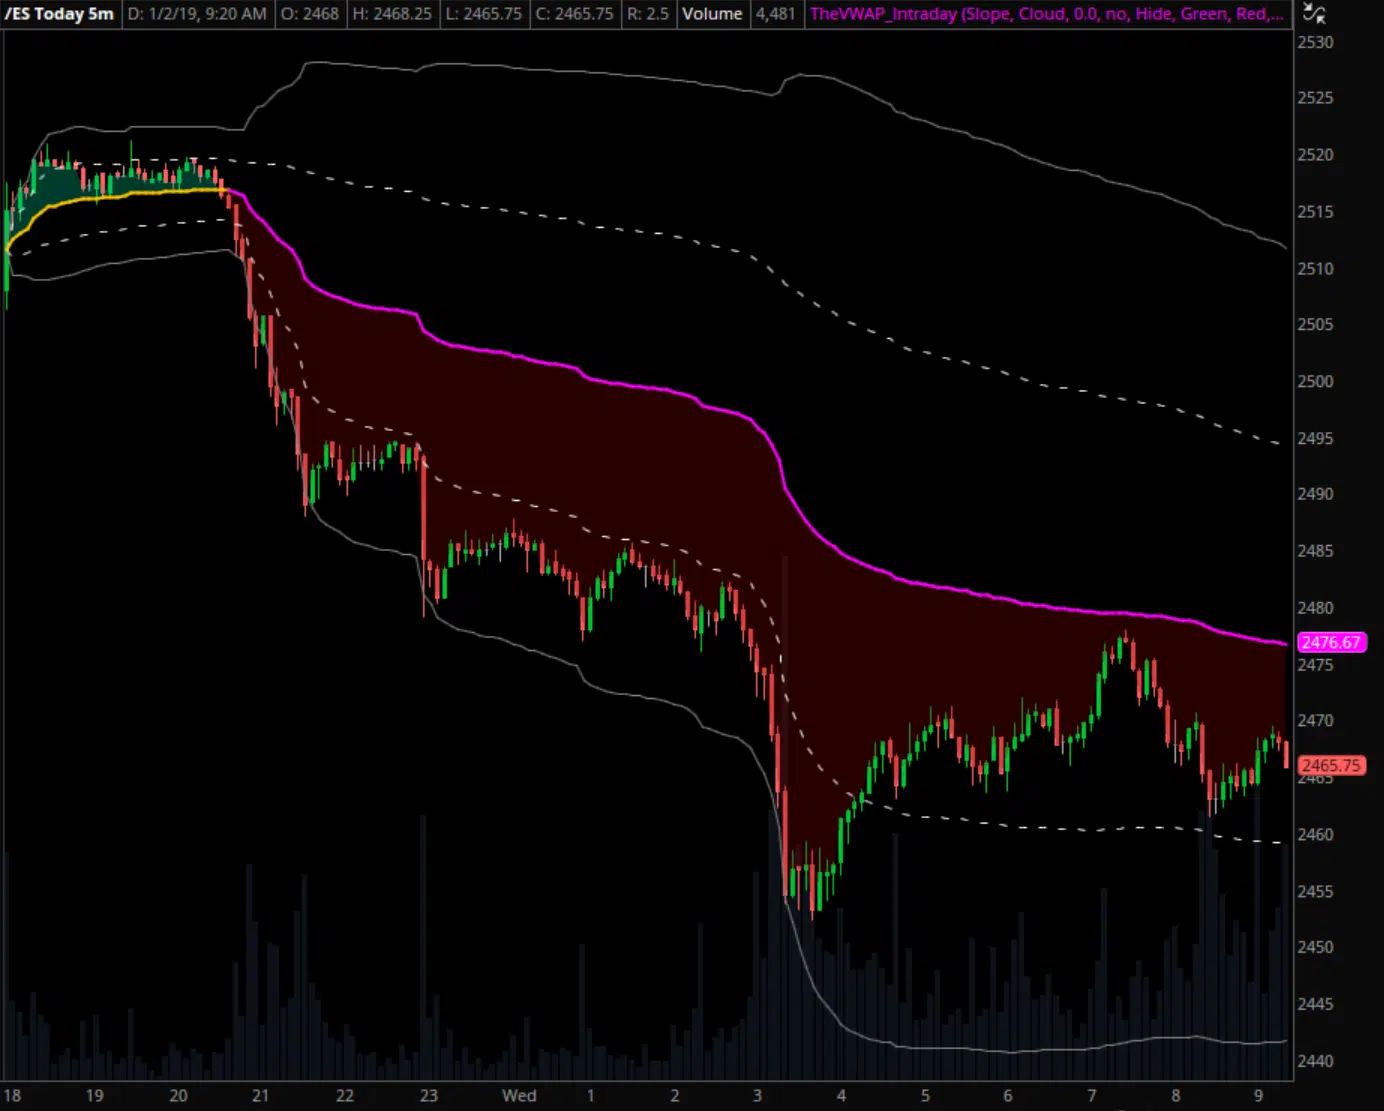
S&P 500 1/2/19 — Intraday VWAP with deviation bands
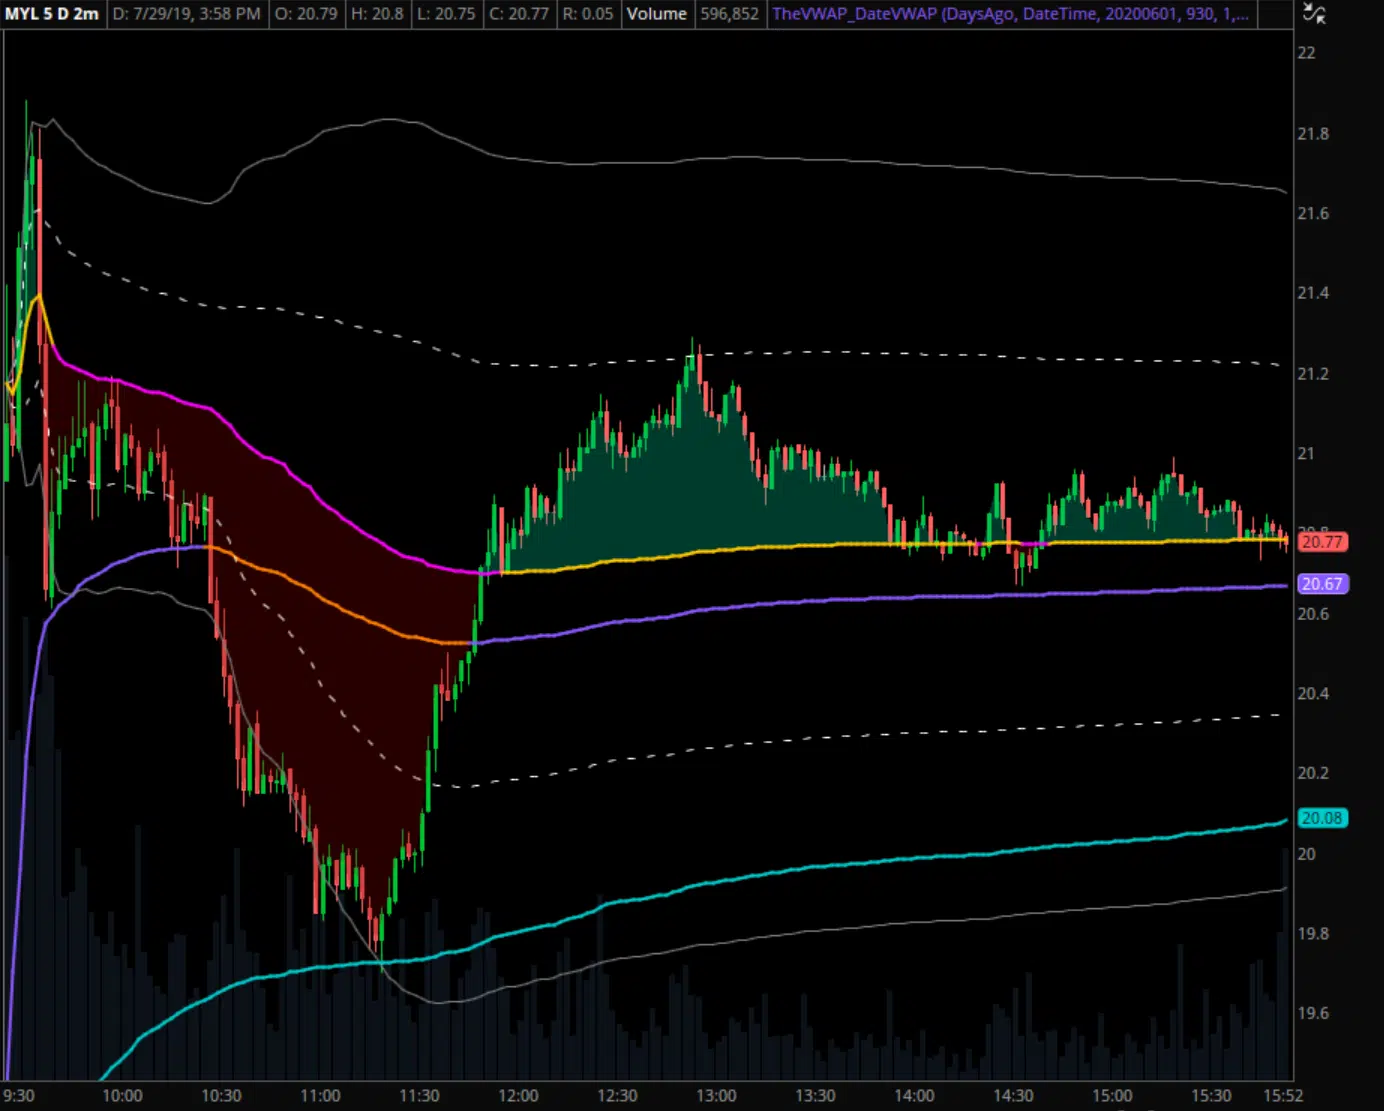
MYL 7/29/19 — VWAP with dev bands + PD VWAP + 5-day VWAP
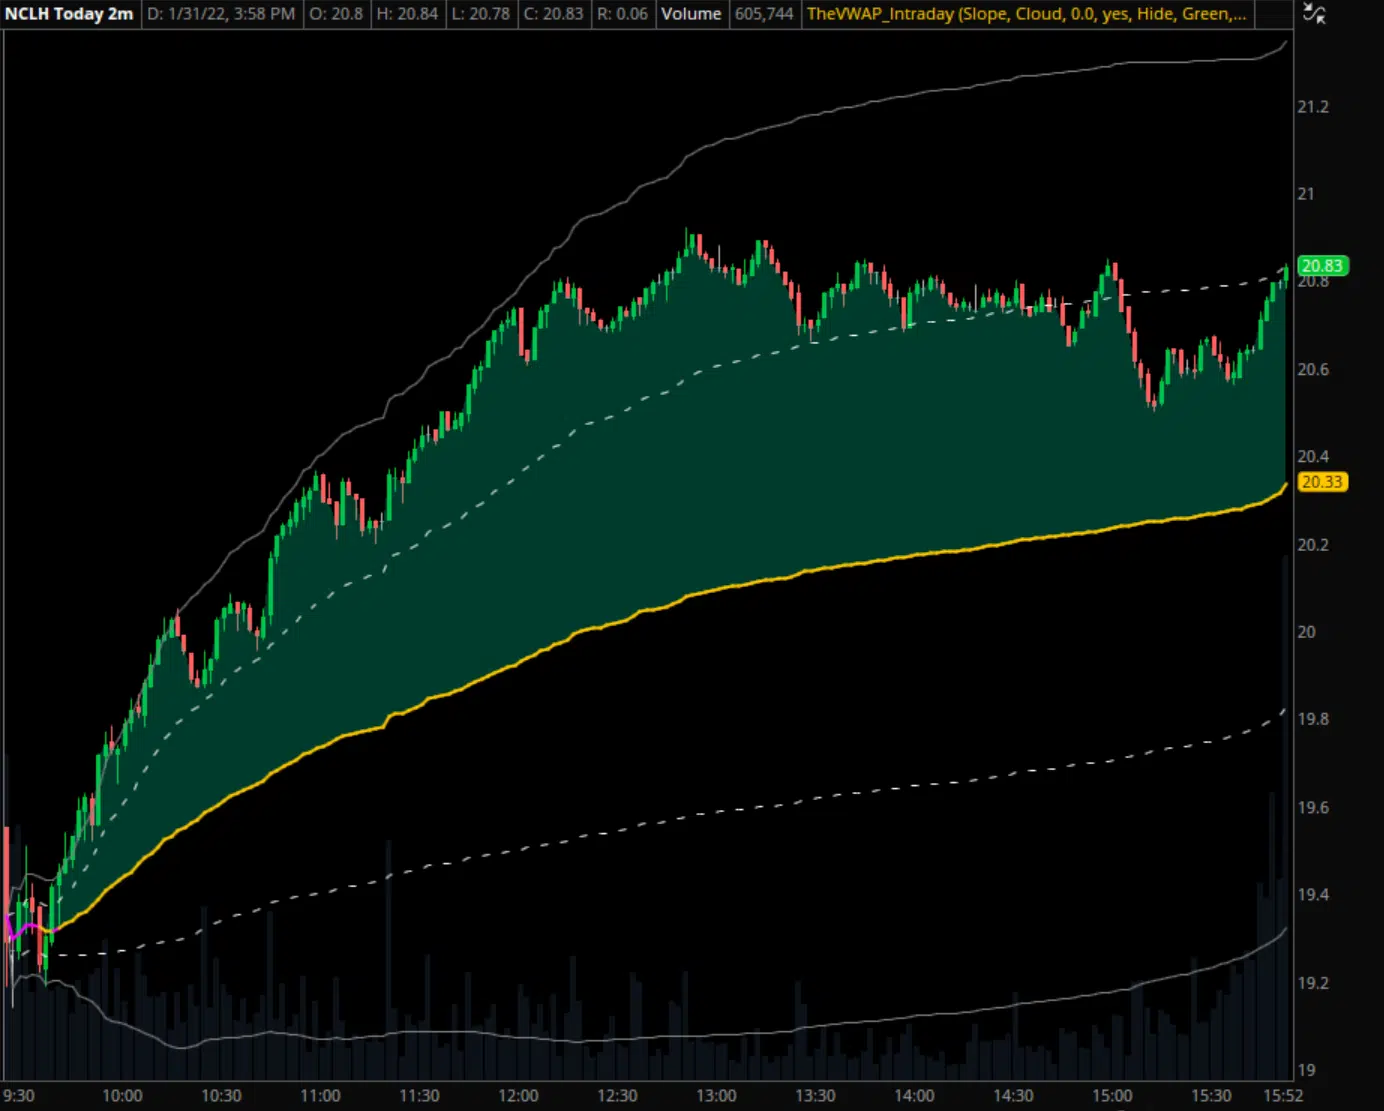
NCLH 1/31/22 — Intraday VWAP with deviation bands
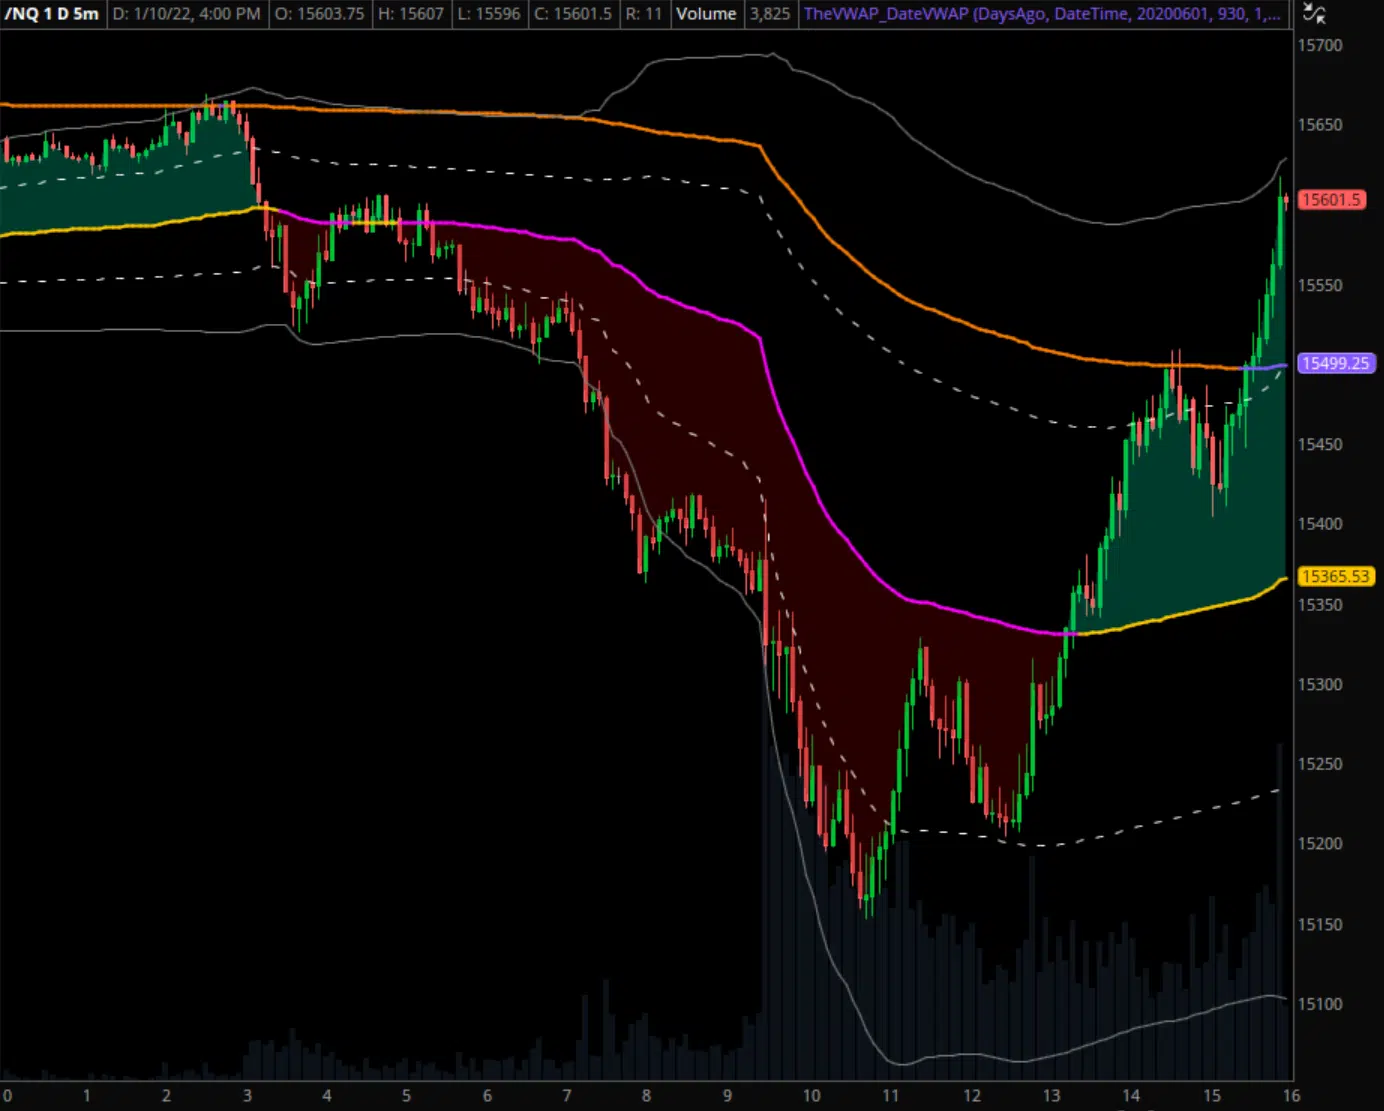
NASDAQ 100 1/10/22 — Intraday VWAP with dev bands + PD VWAP
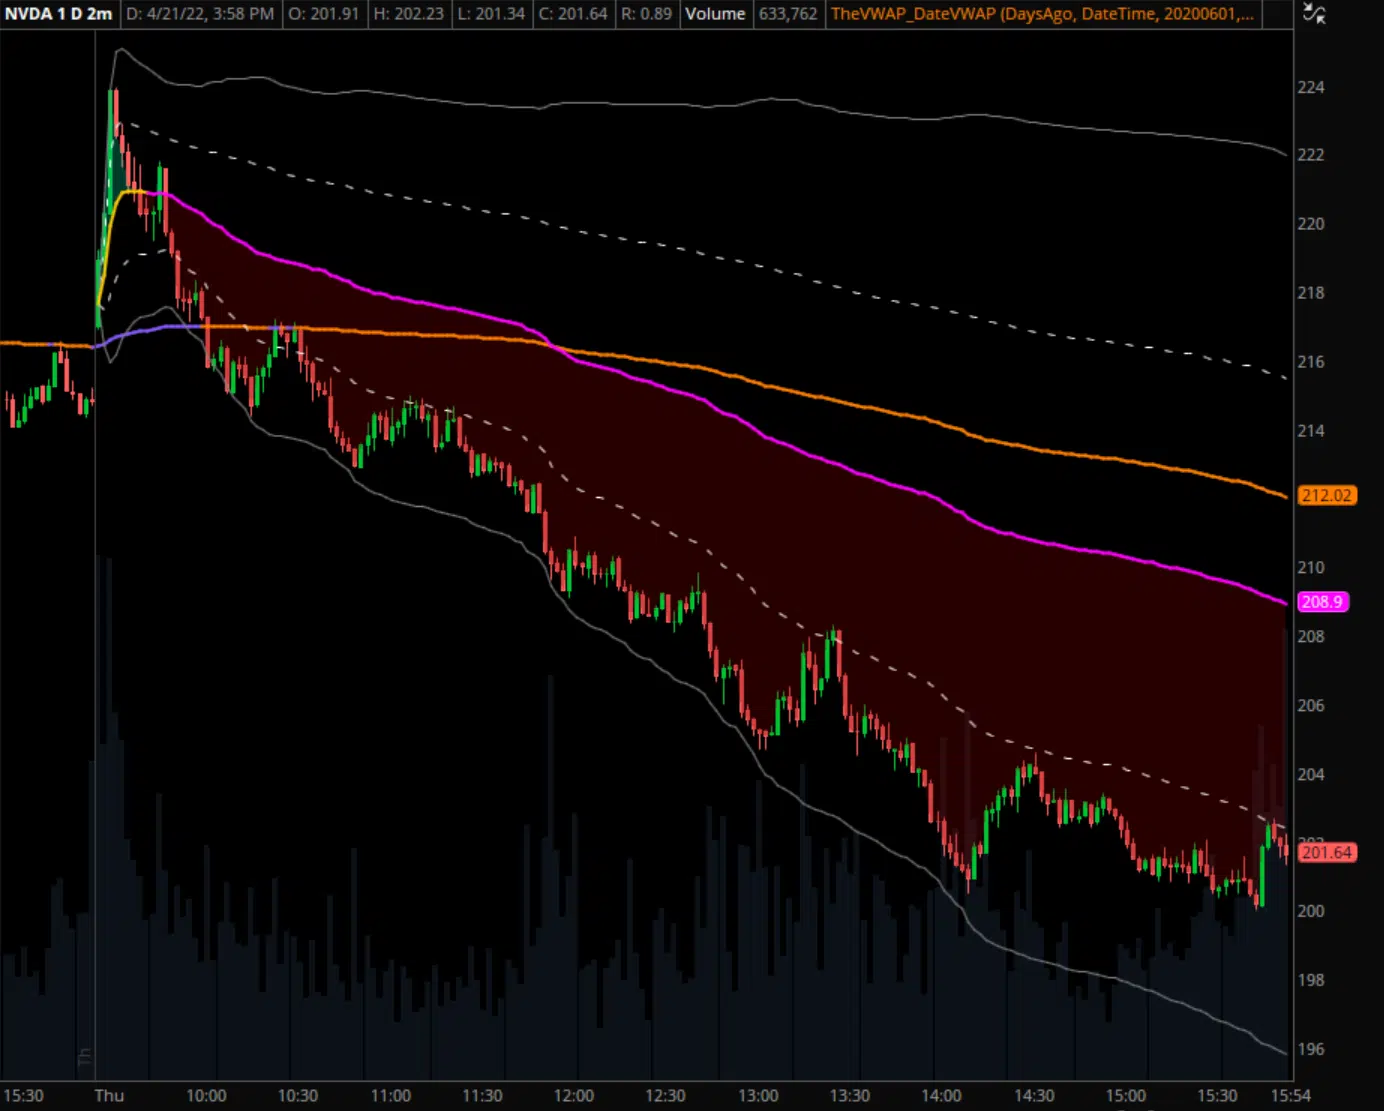
NVDA 4/21/22 — Intraday VWAP with dev bands + PD VWAP
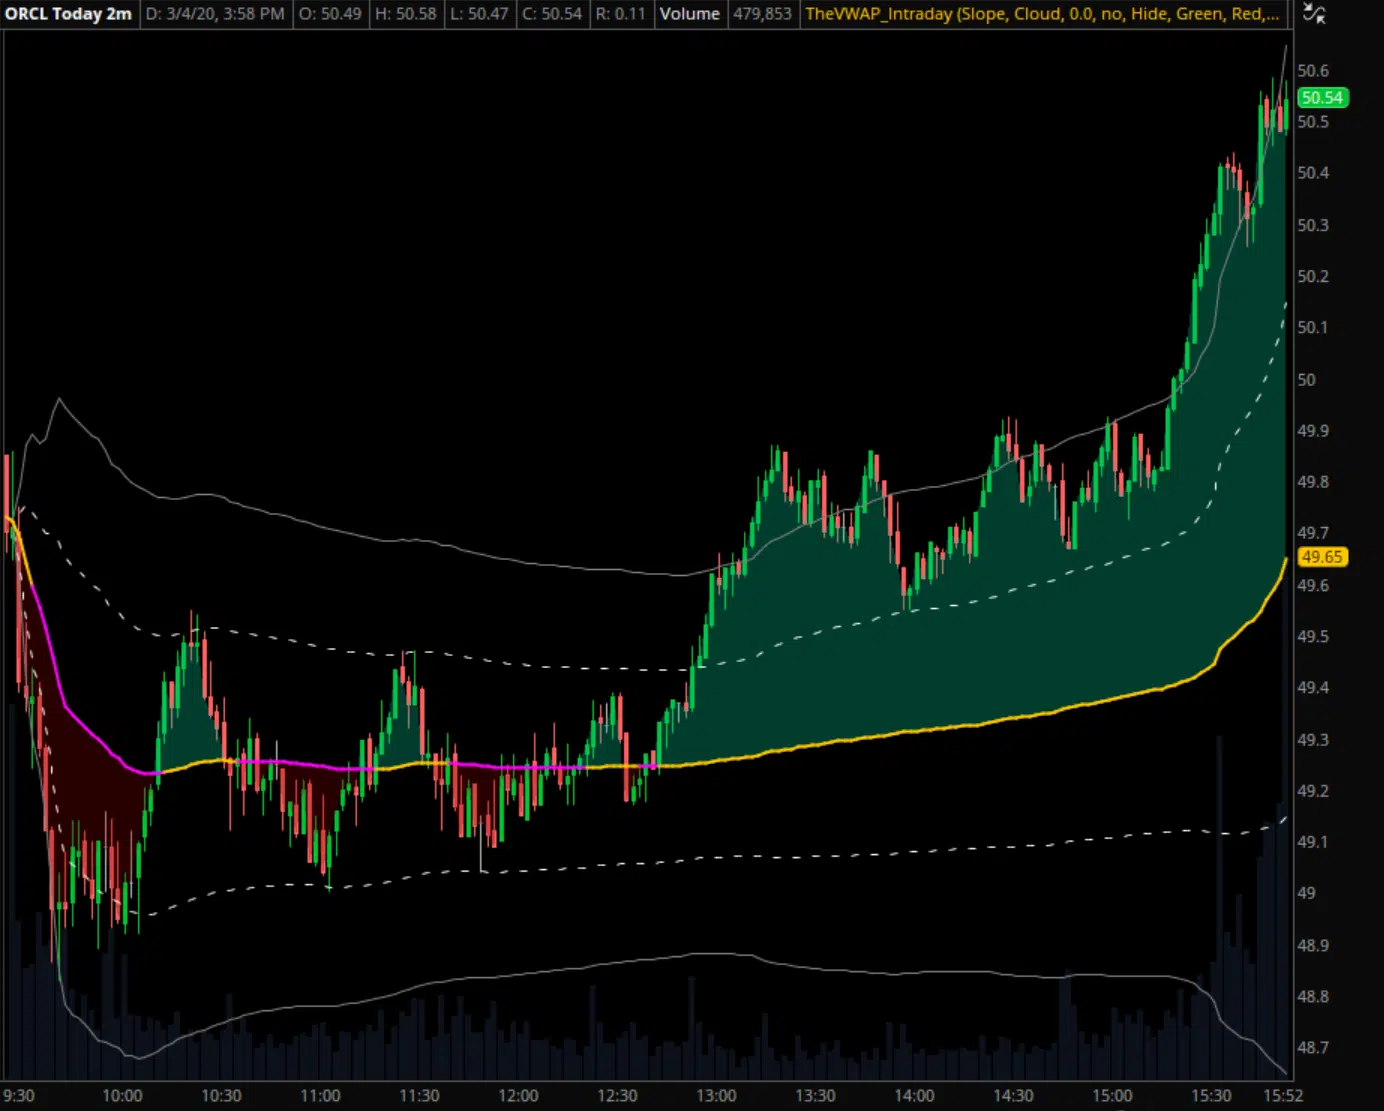
ORCL 3/4/20 — Intraday VWAP with deviation bands
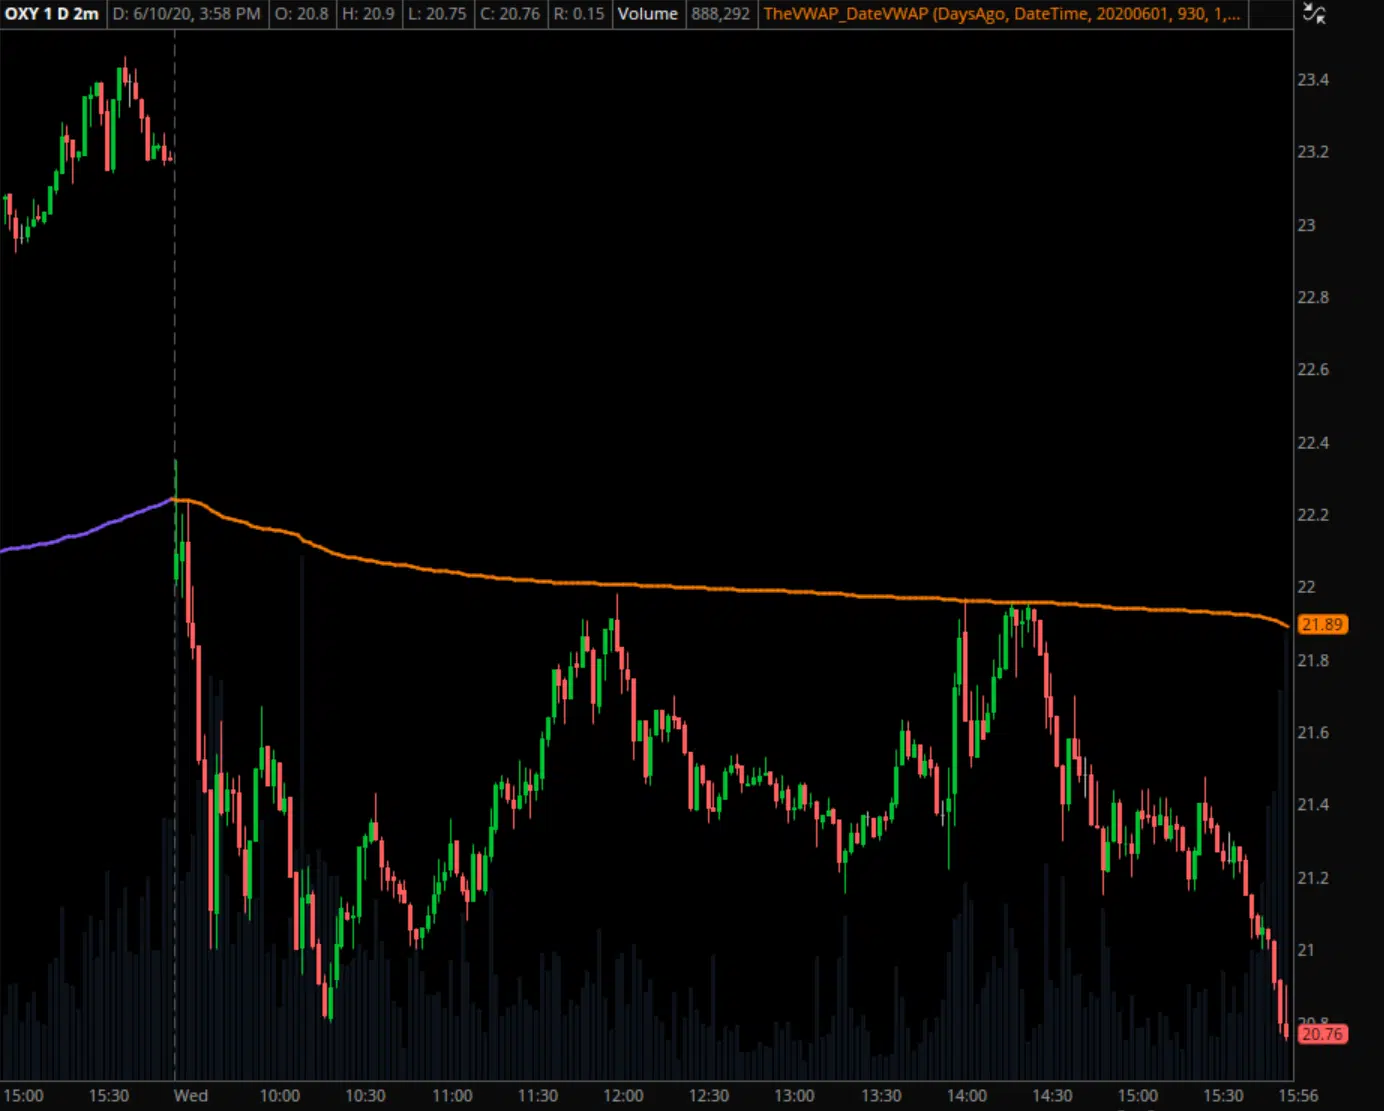
OXY 6/10/20 — Prior day's VWAP
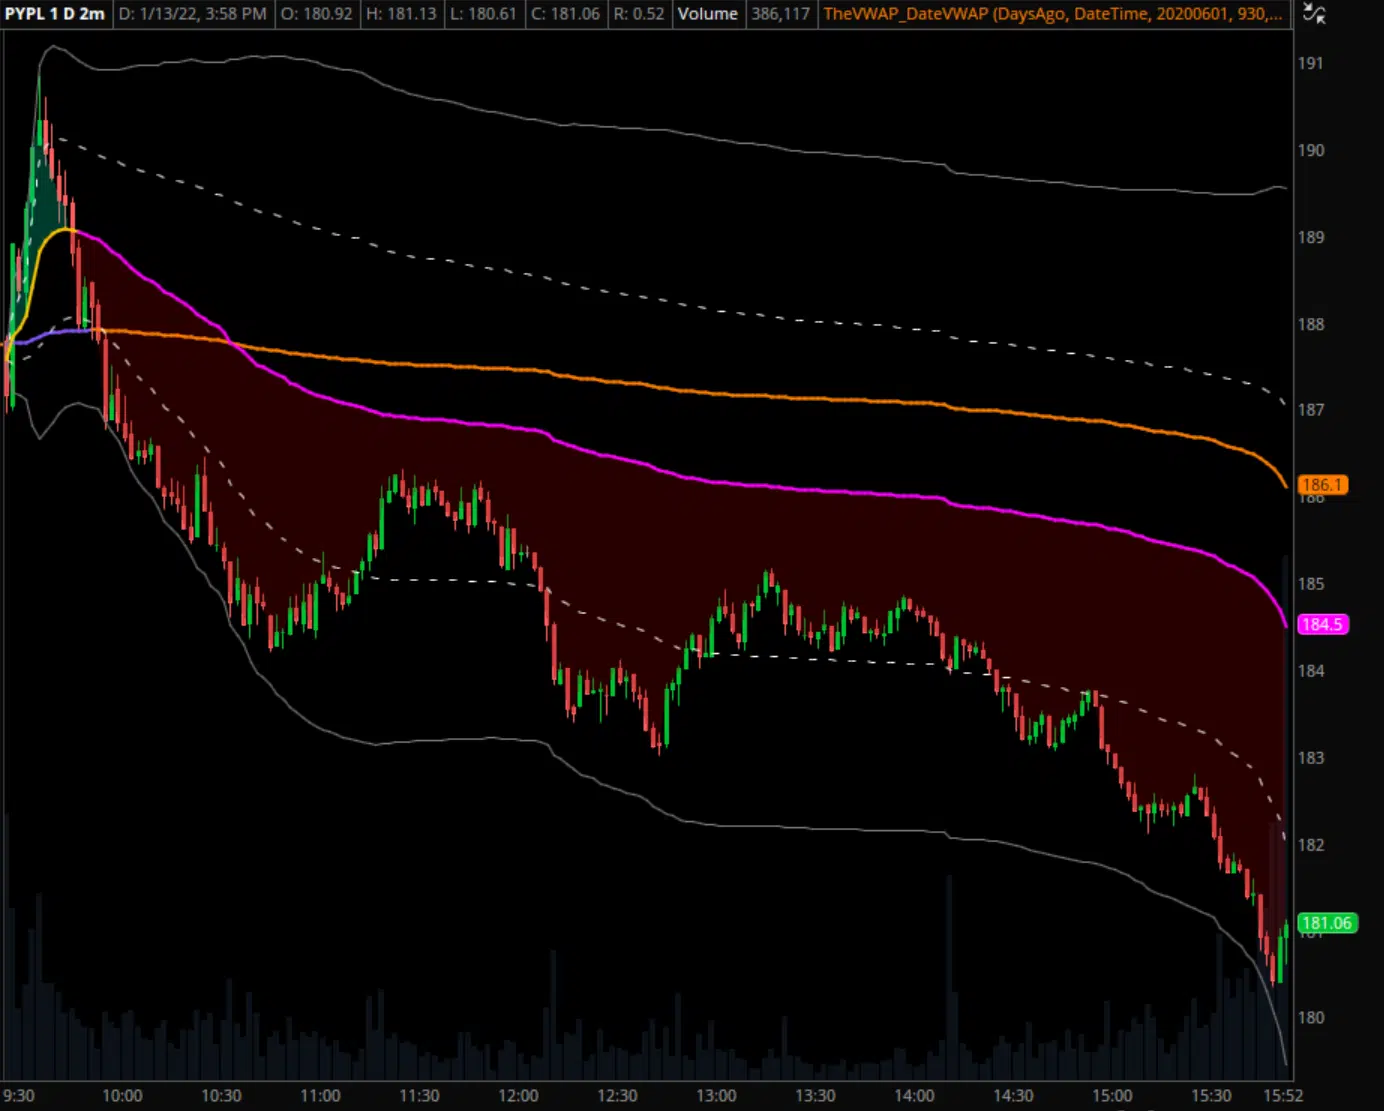
PYPL 1/13/22 — Intraday VWAP with dev bands + PD VWAP
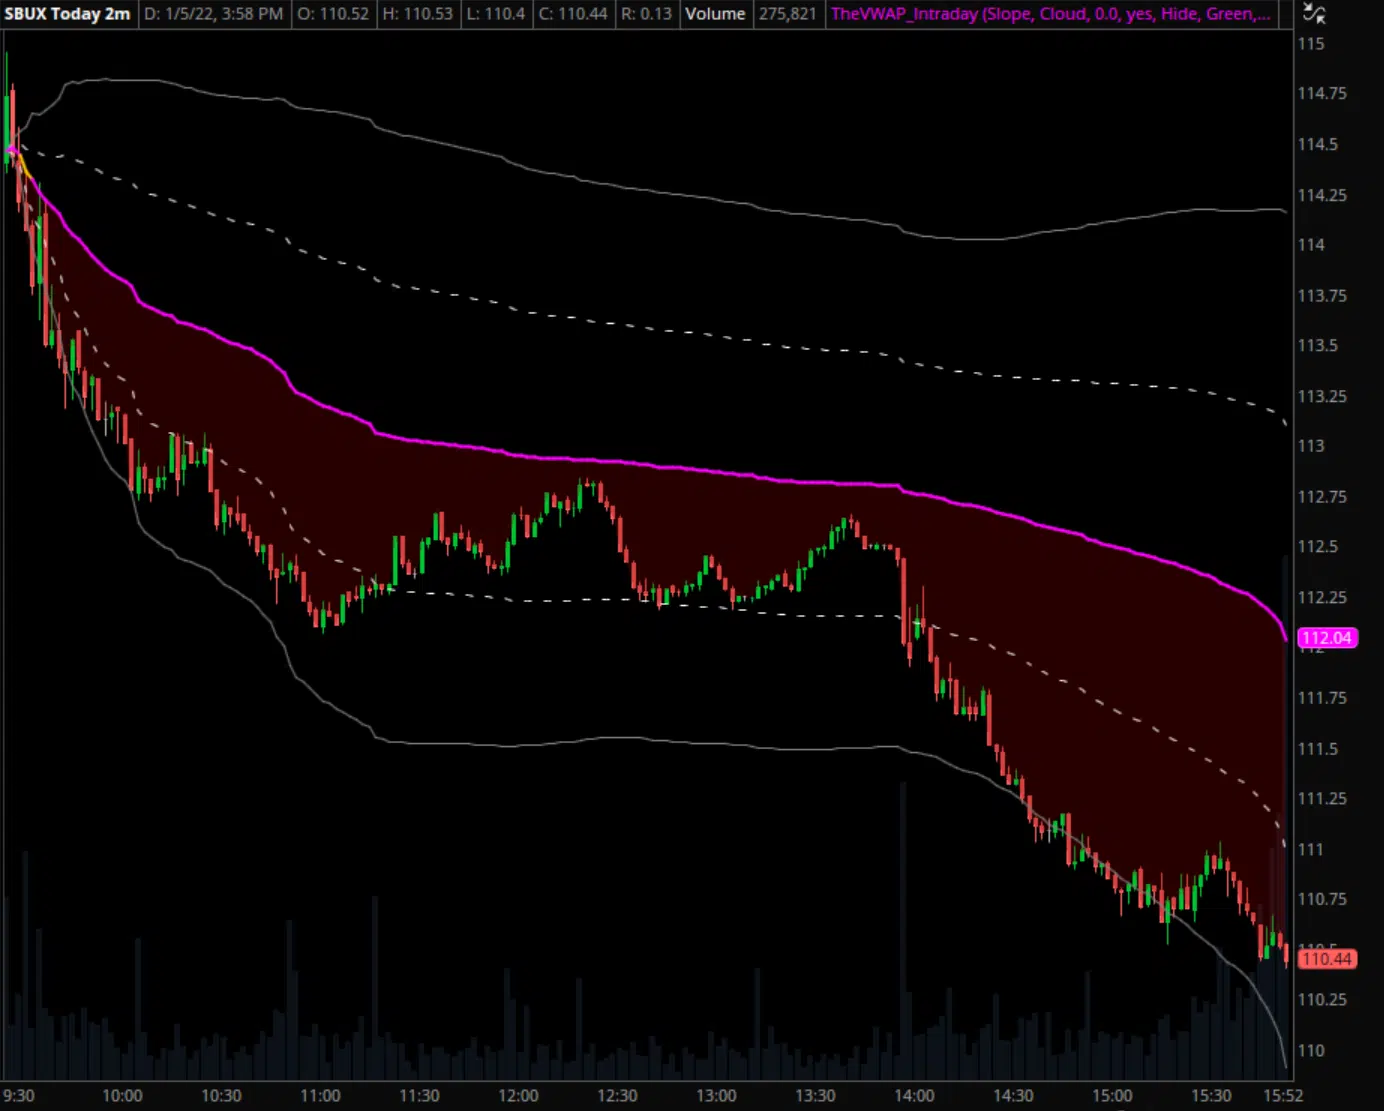
SBUX 1/5/22 — Intraday VWAP with deviation bands
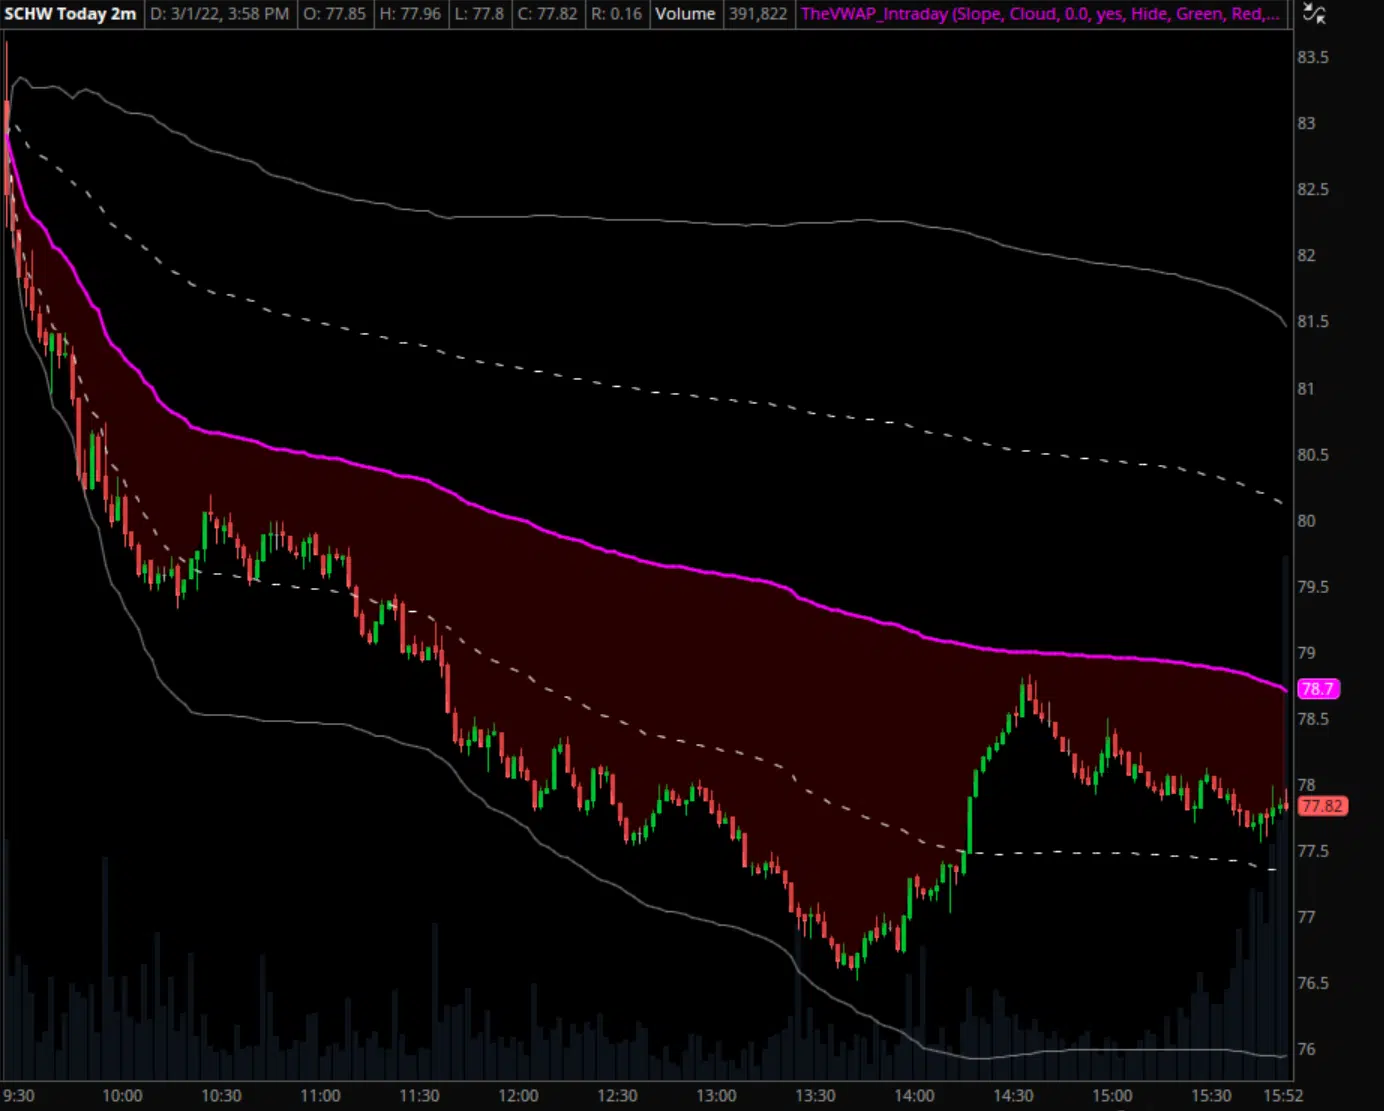
SCHW 3/1/22 — Intraday VWAP with deviation bands
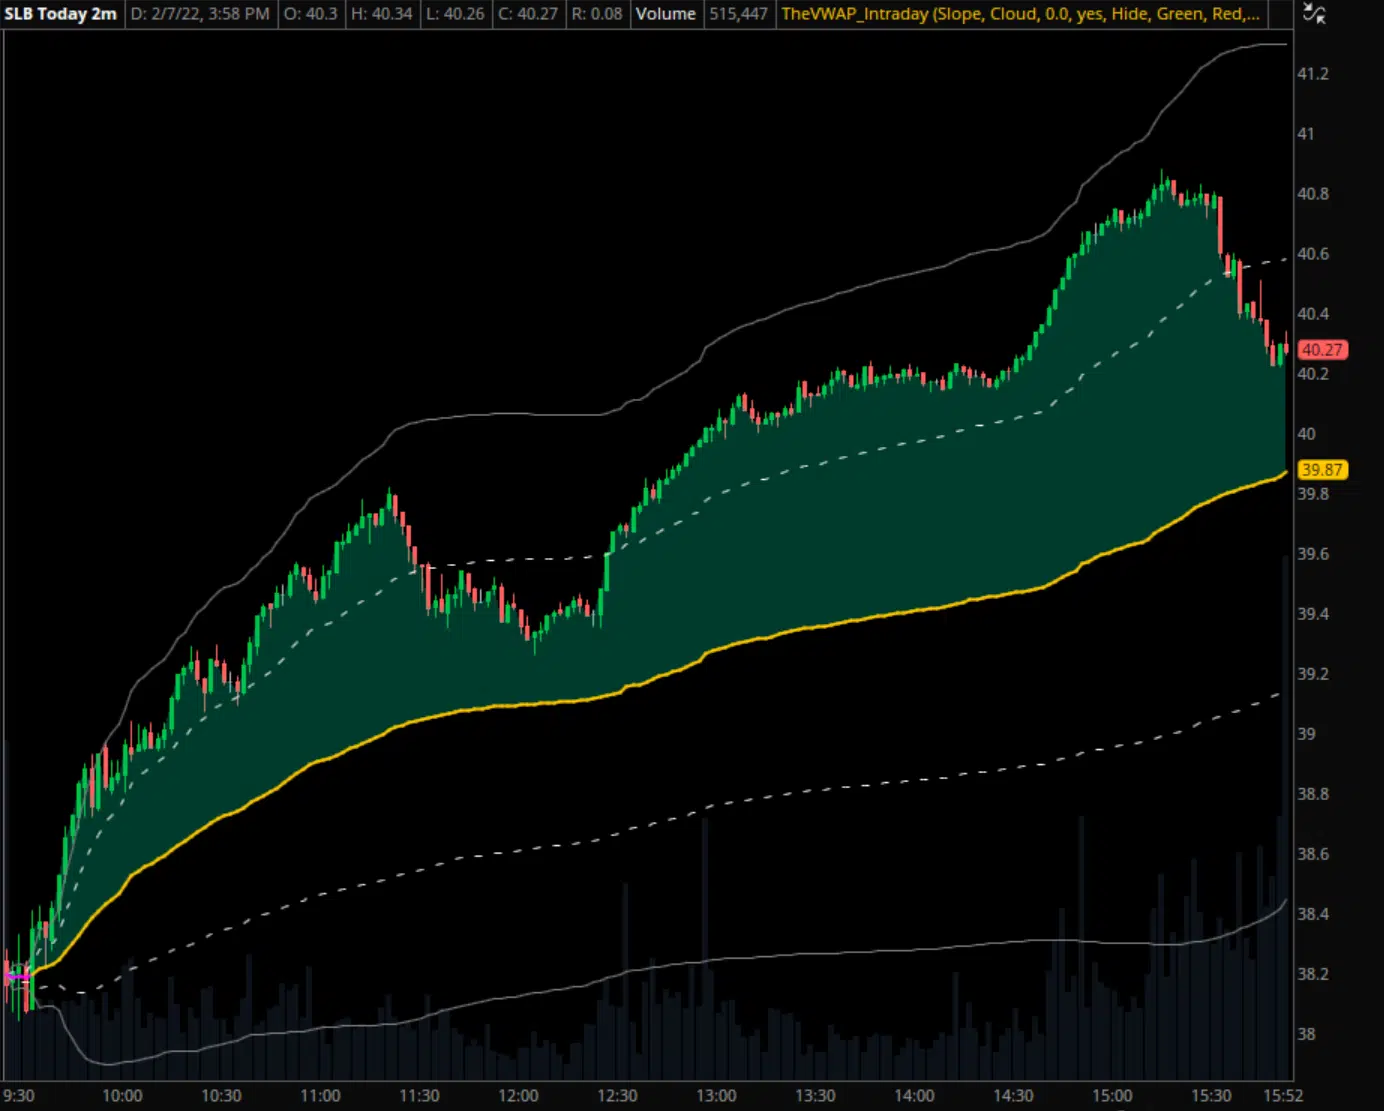
SLB 2/7/22 — Intraday VWAP with deviation bands
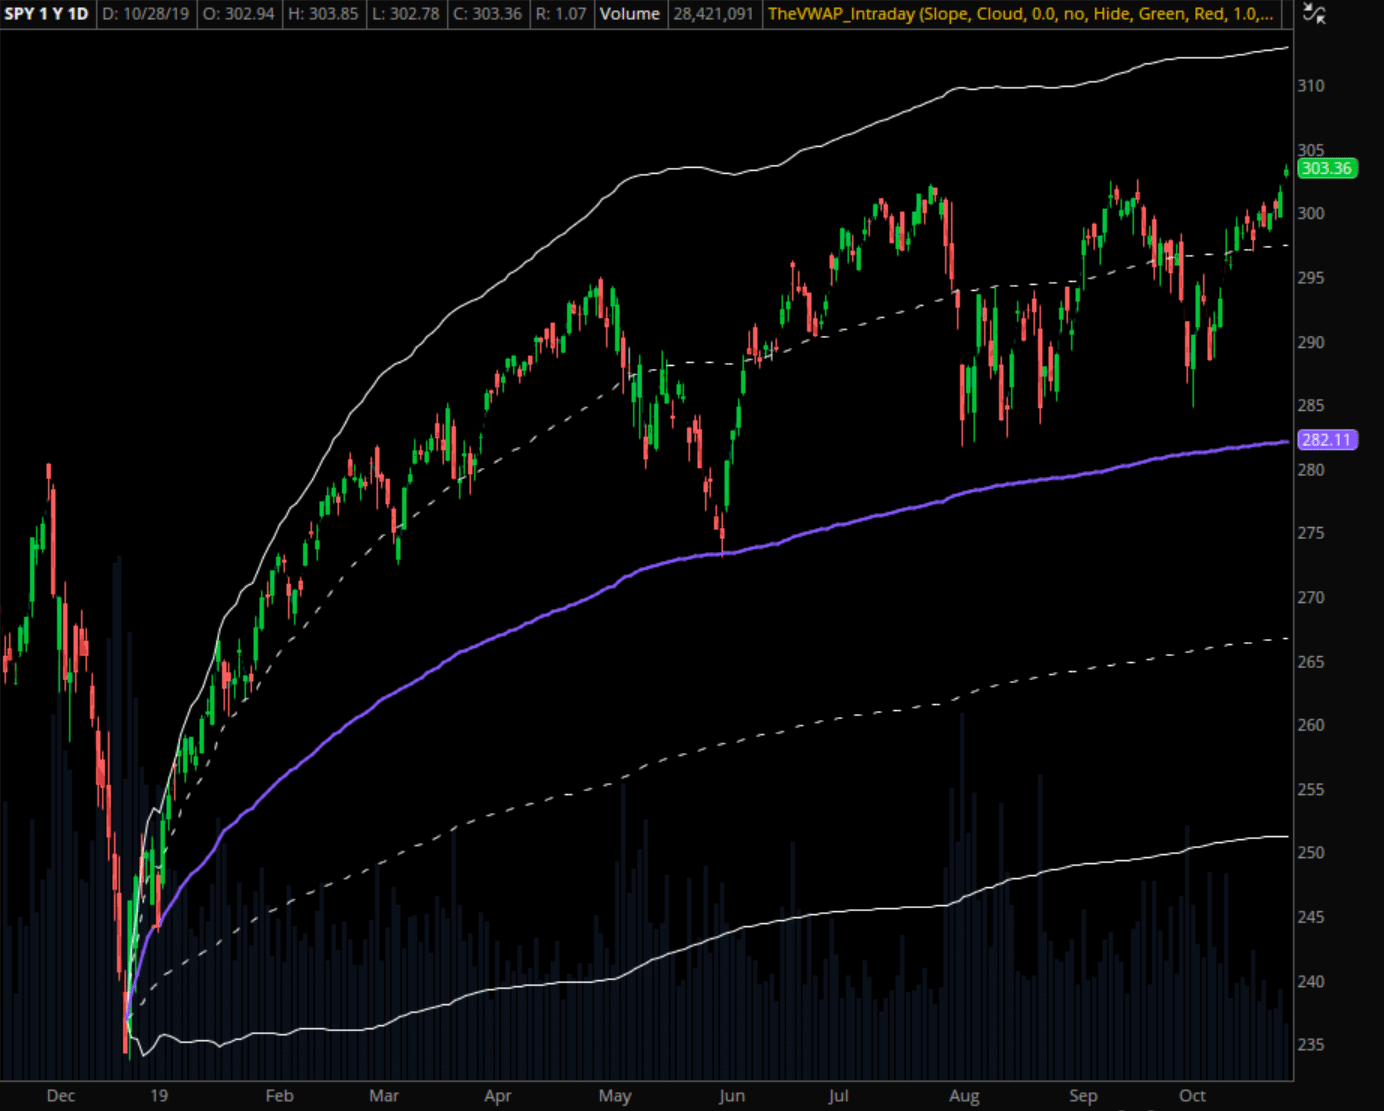
SPY Daily Chart — VWAP and dev bands anchored to 12/24/18
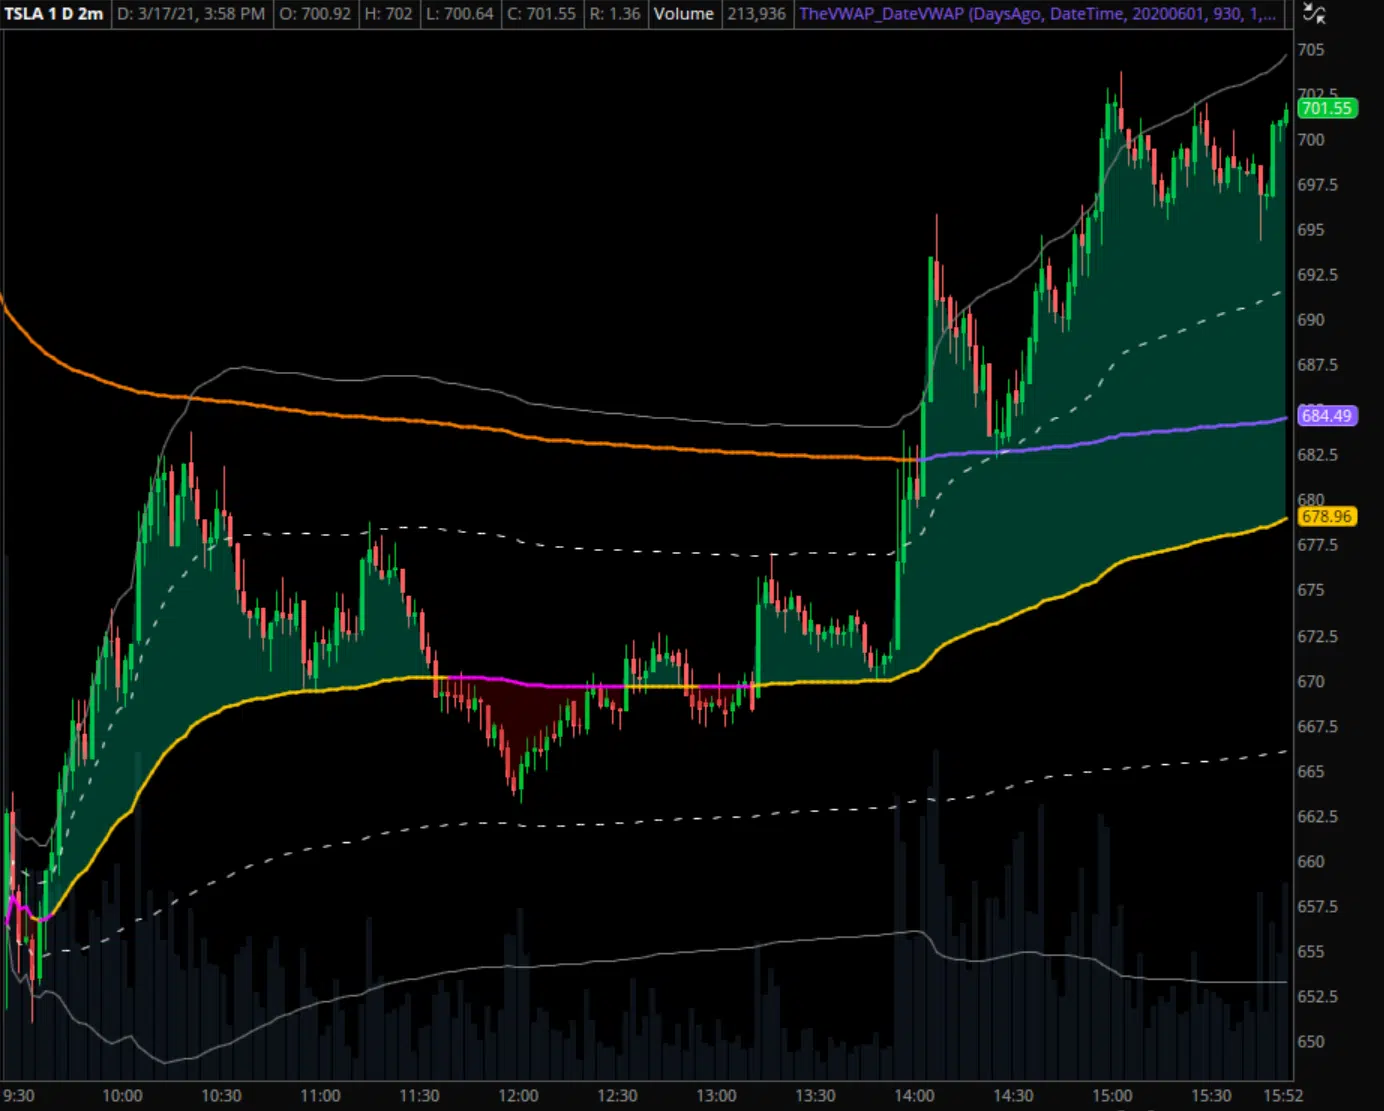
TSLA 3/17/21 — Intraday VWAP with dev bands + PD VWAP
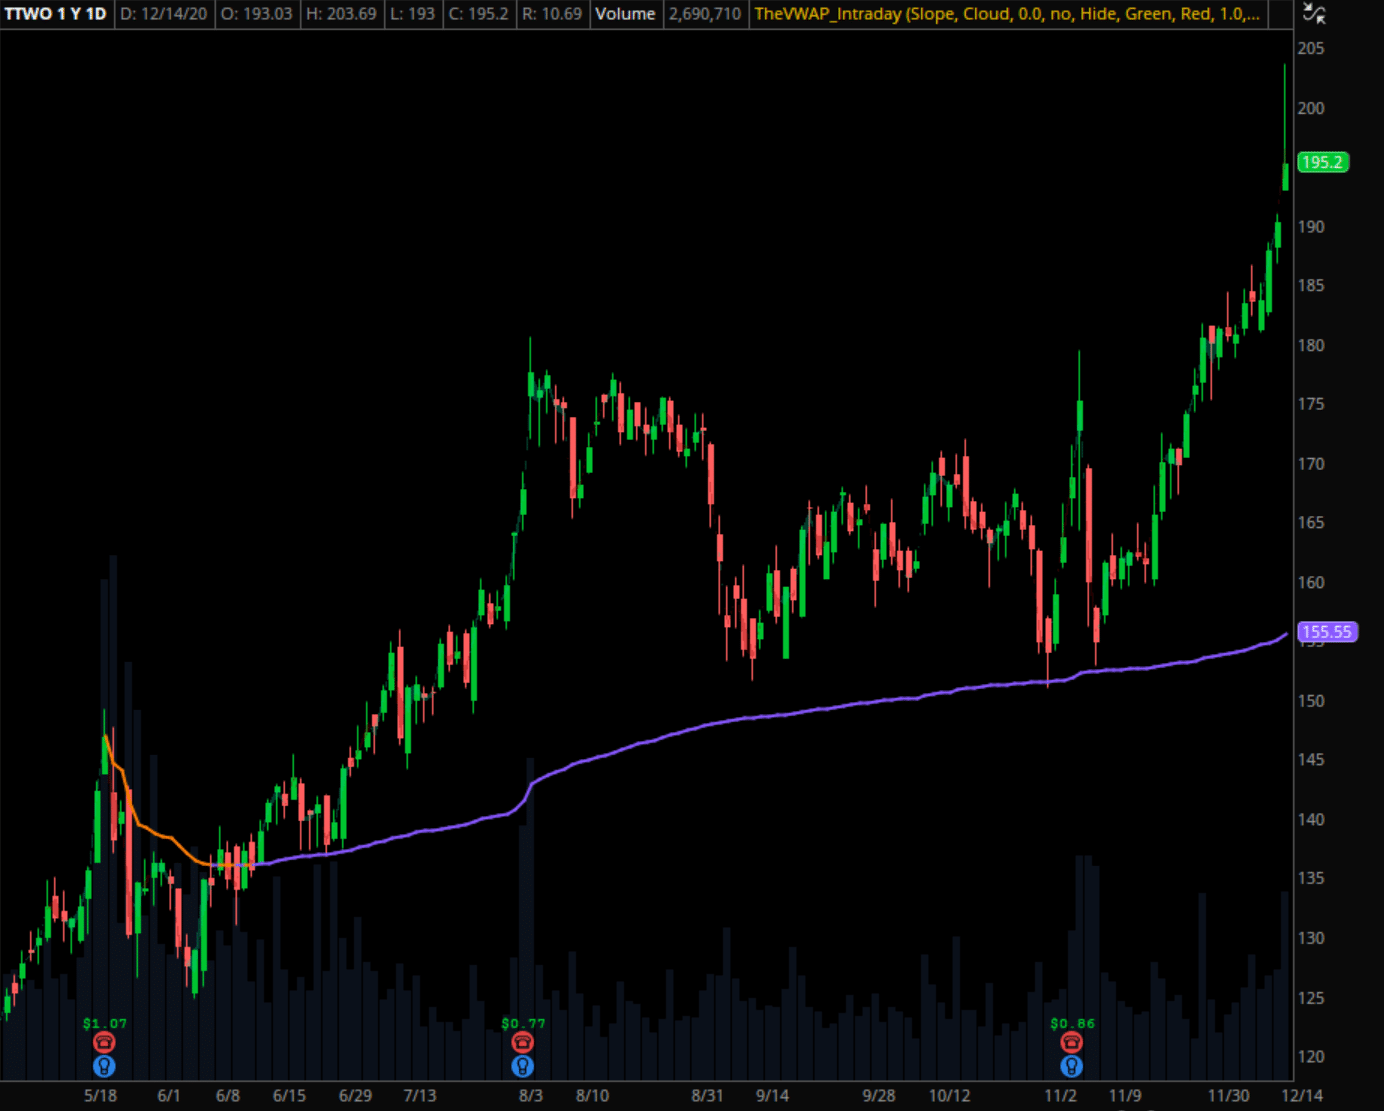
TTWO 2020 Daily Chart — VWAP anchored to 5/18 earnings report
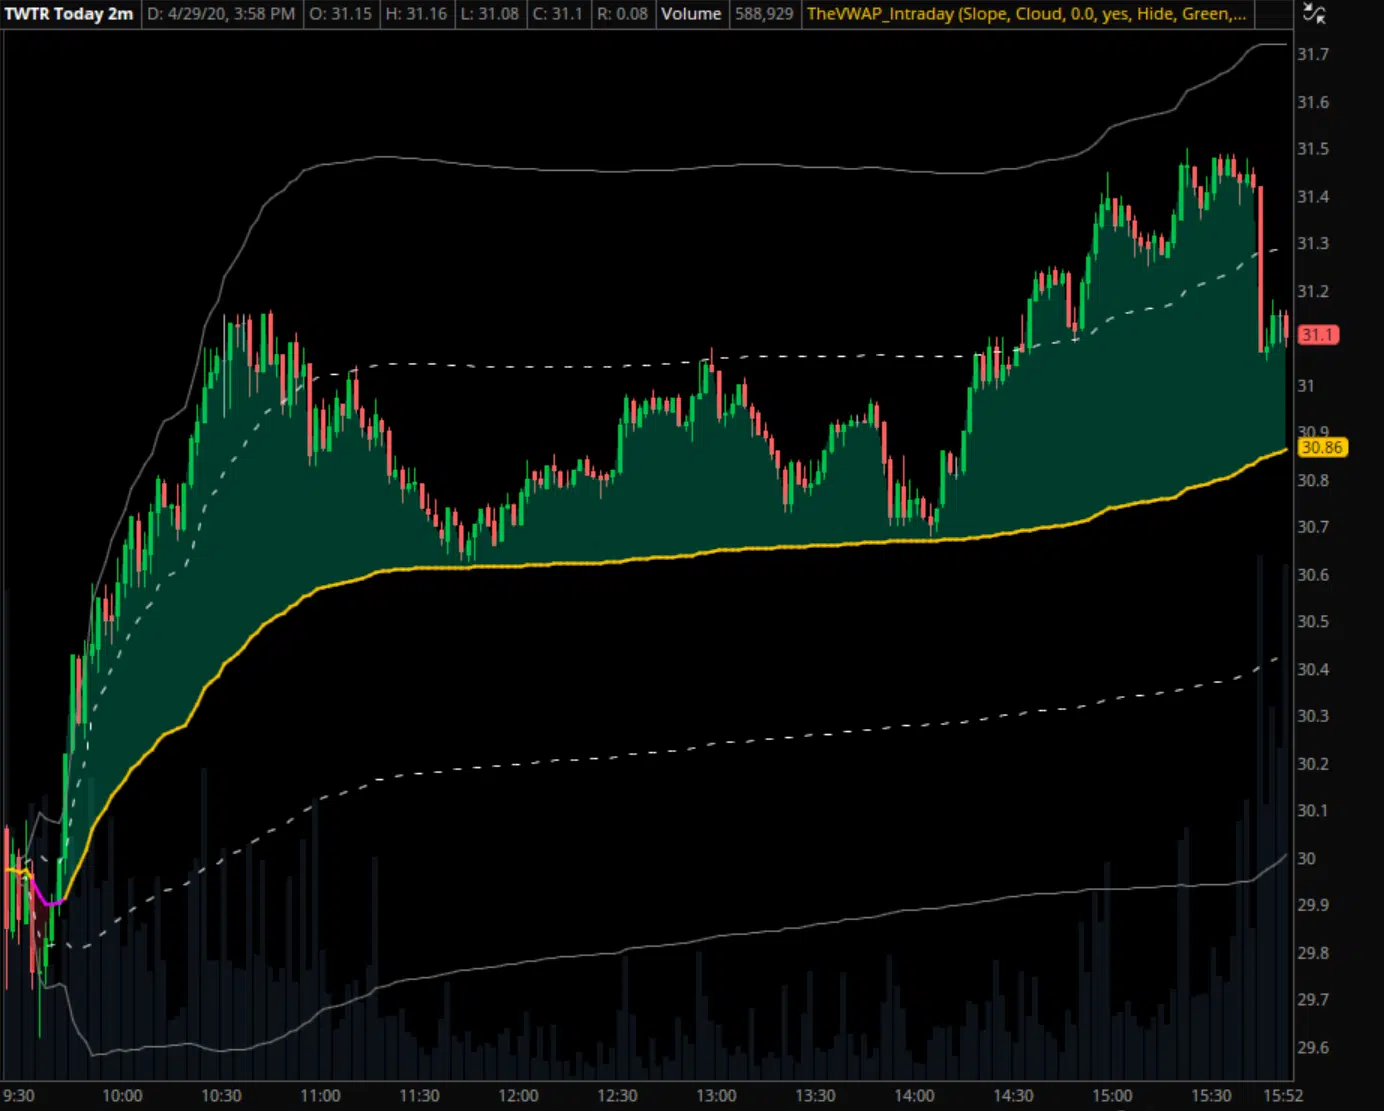
TWTR 4/9/20 — Intraday VWAP with deviation bands
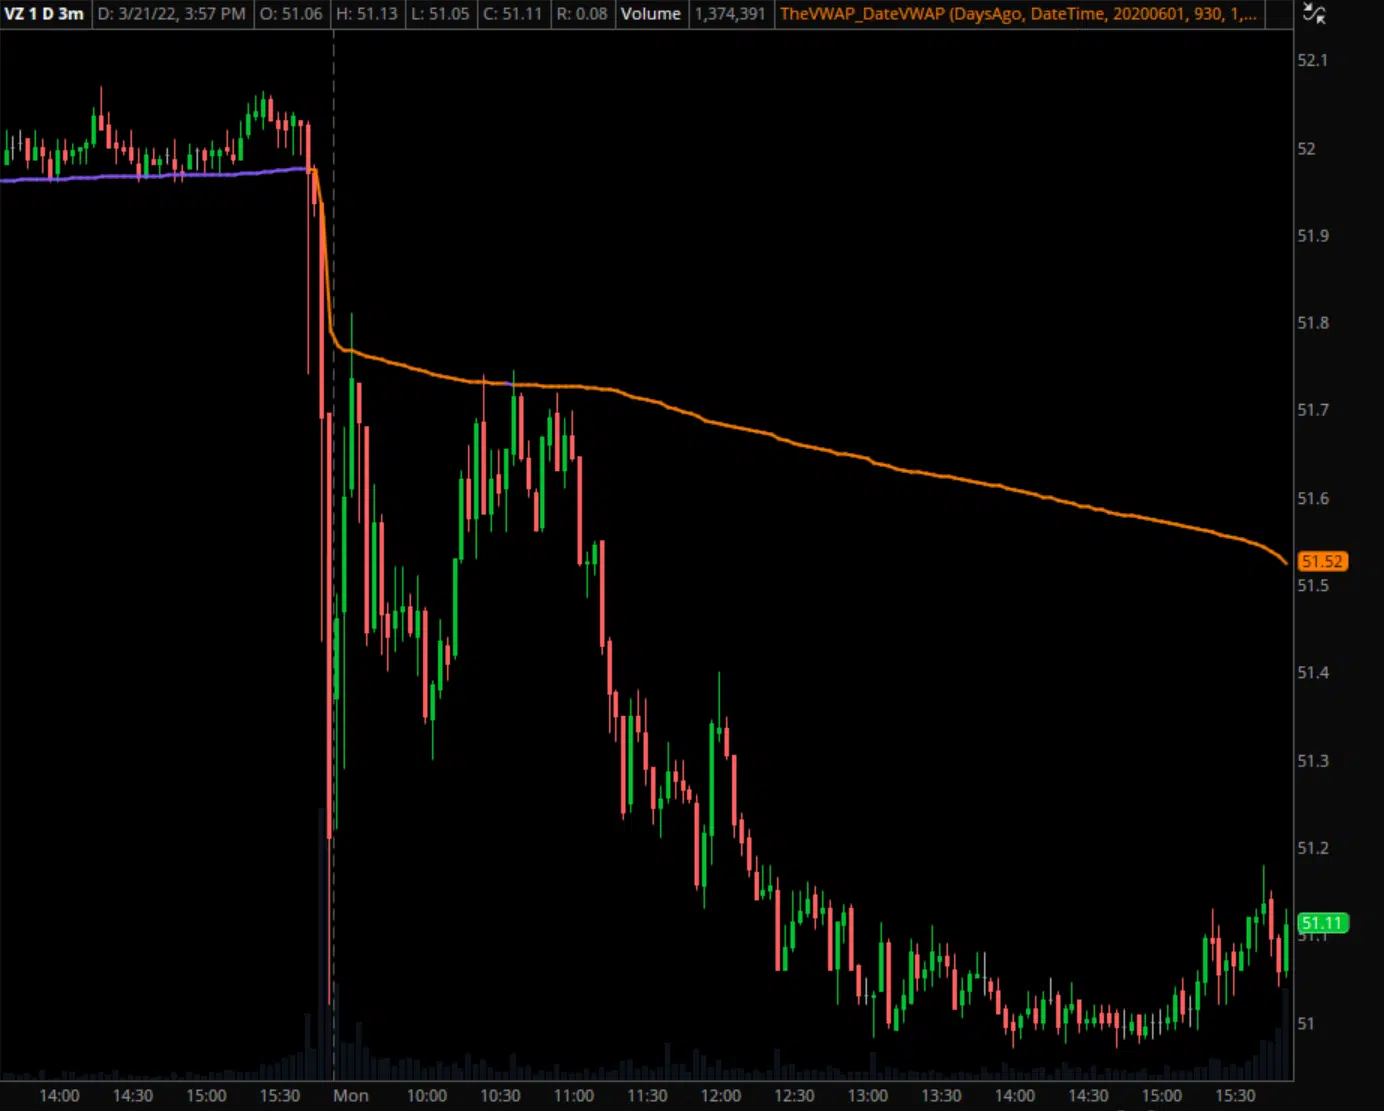
VZ 3/1/22 — Prior day's VWAP
We'll send you our "Intraday" indicator for free, plus a detailed tutorial.