VWAP Boulevard for thinkorswim

Download our free VWAP indicator and read the import instructions.
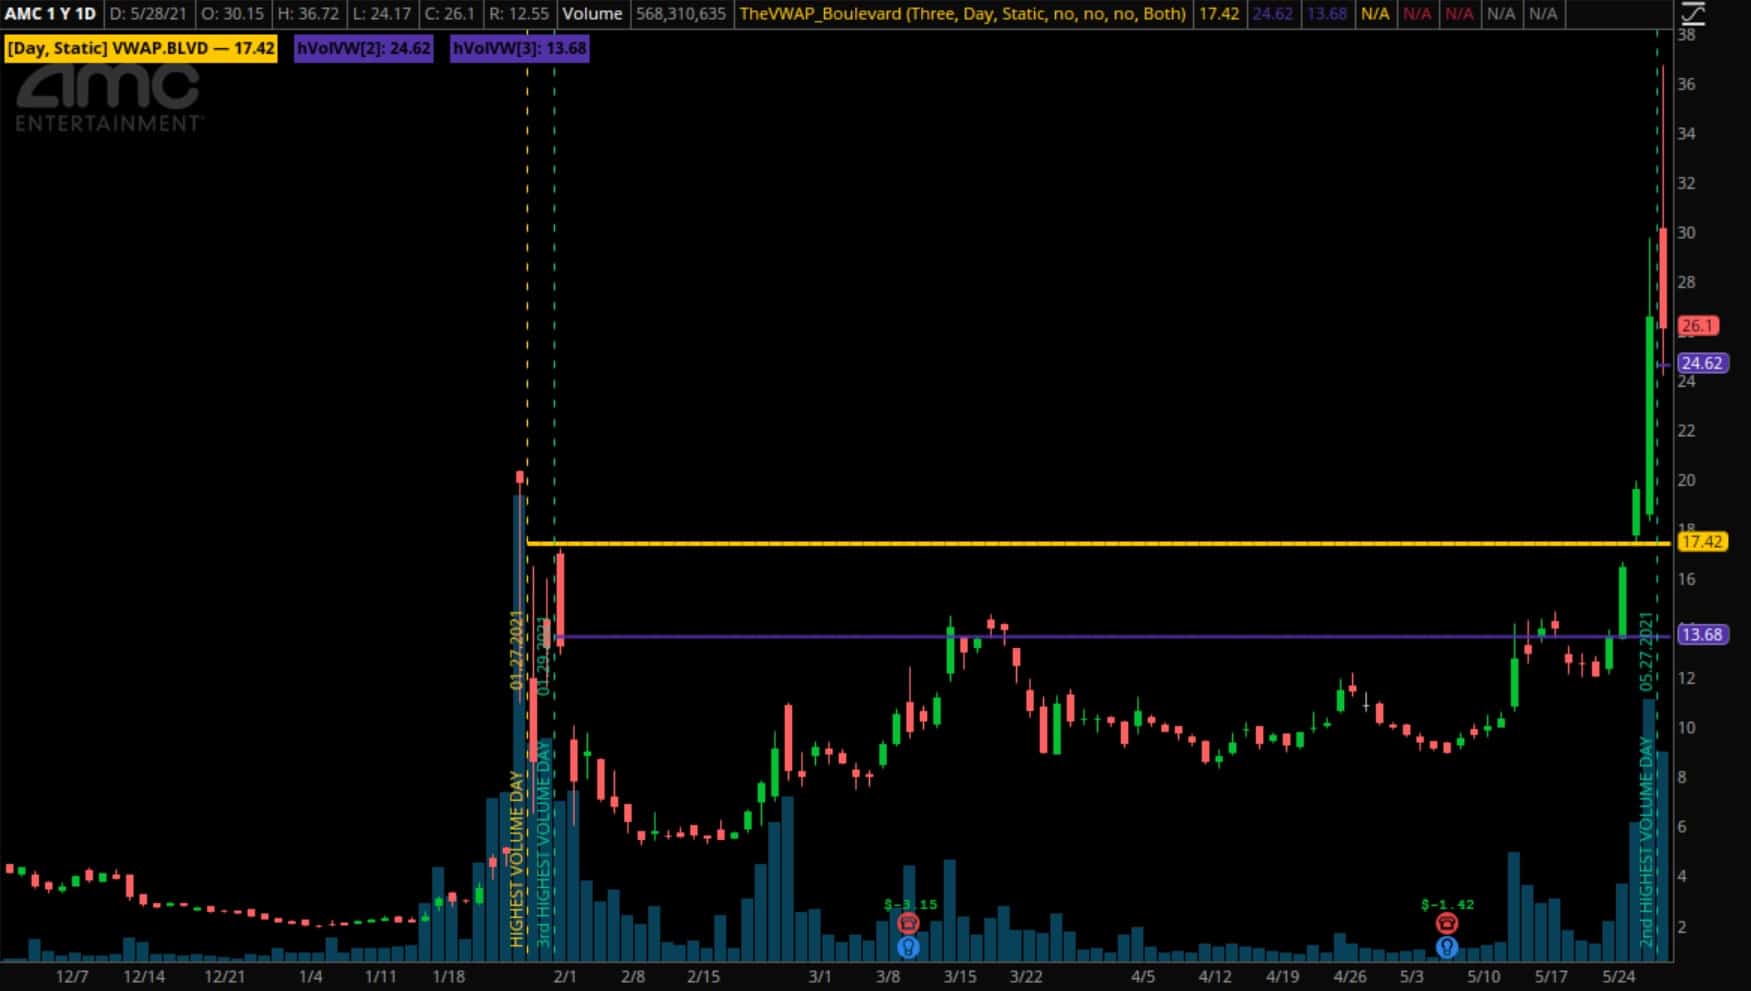
Effective on multiple timeframes, VWAP Boulevard auto-detects the three highest-volume candles in a chart’s
history and launches both static and continuous VWAPs from each of the identified anchor points.
Please read the section below for import instructions when adding the indicator to your platform.
Import Instructions
Step 1 – Once you’ve downloaded the indicator, it will appear as a zipped folder titled “TheVWAP-Boulevard”. Open your Downloads, right-click the folder and select “Extract All”. Click Browse, choose your desired destination for the unzipped folder and then click “Extract”.

Step 2 – Your unzipped folder should contain two files — one code file and one text file. Don’t click anything just yet. The code file may produce an error if you attempt to open it, but this is just due to thinkorswim’s “.ts” file extension making your PC think it’s something other than TOS code.

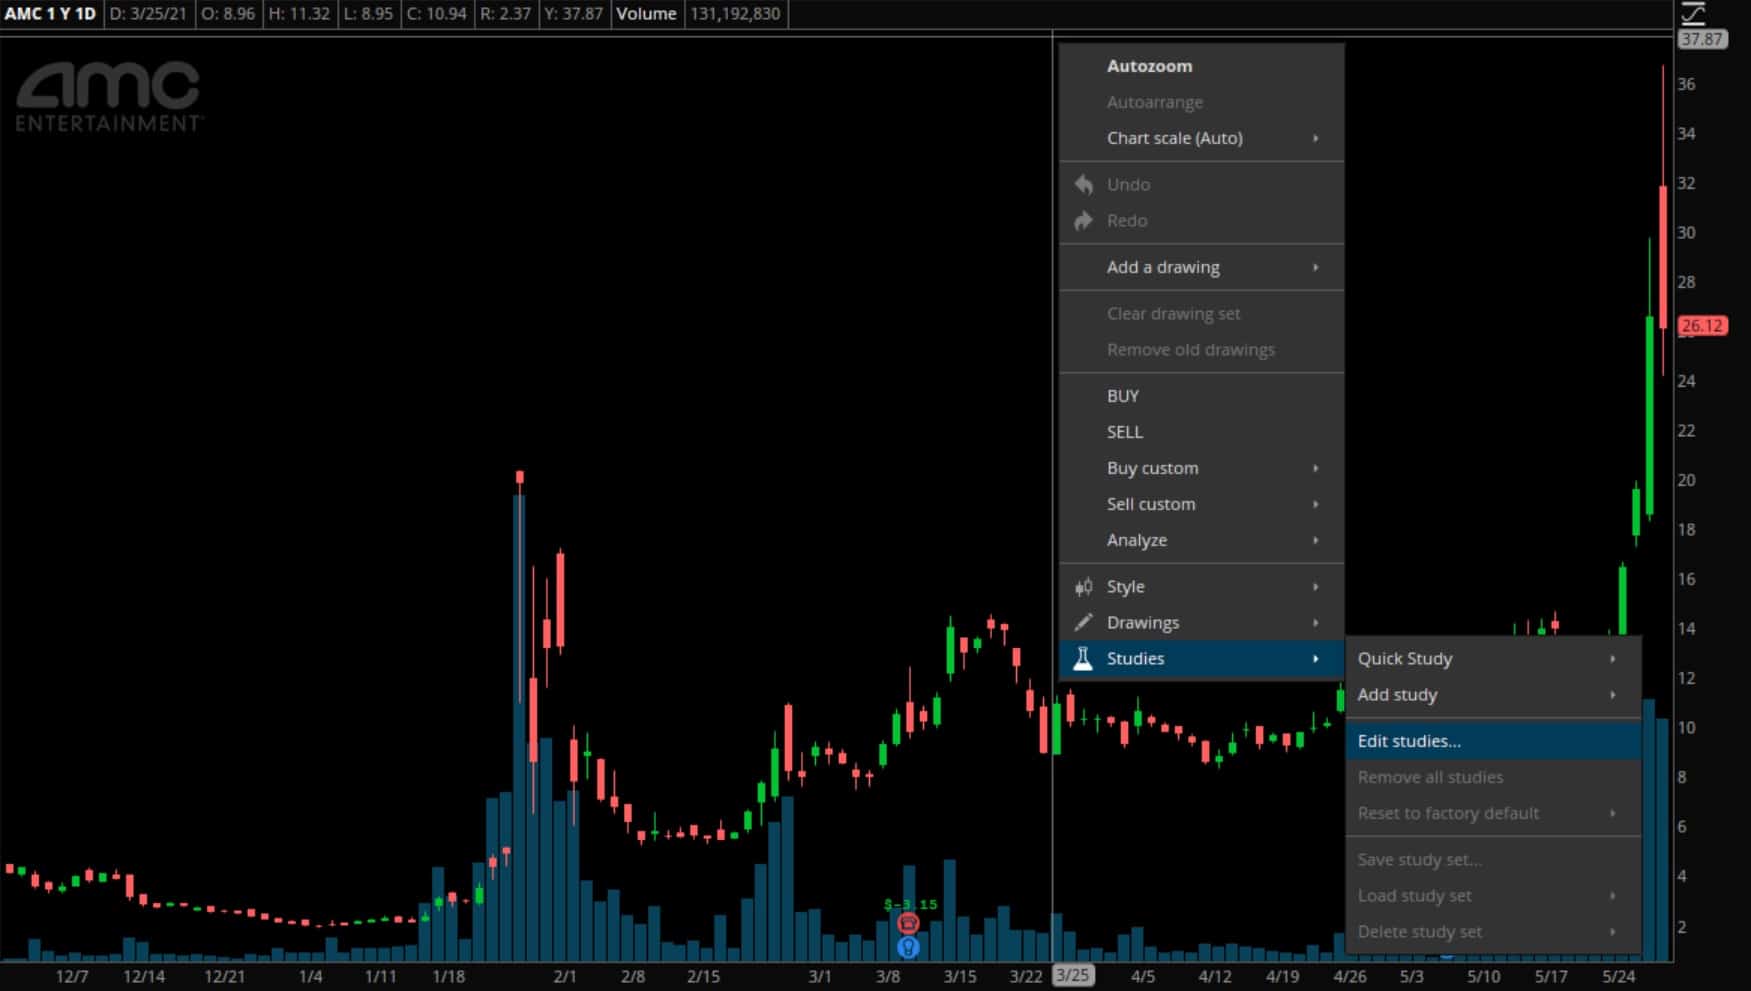
Step 3 – Open thinkorswim and pull up any blank chart. Right-click anywhere within the chart, mouse over “Studies”, and click “Edit Studies”. You can also use the key combination [Control+E] to access the Edit Studies window from any chart.

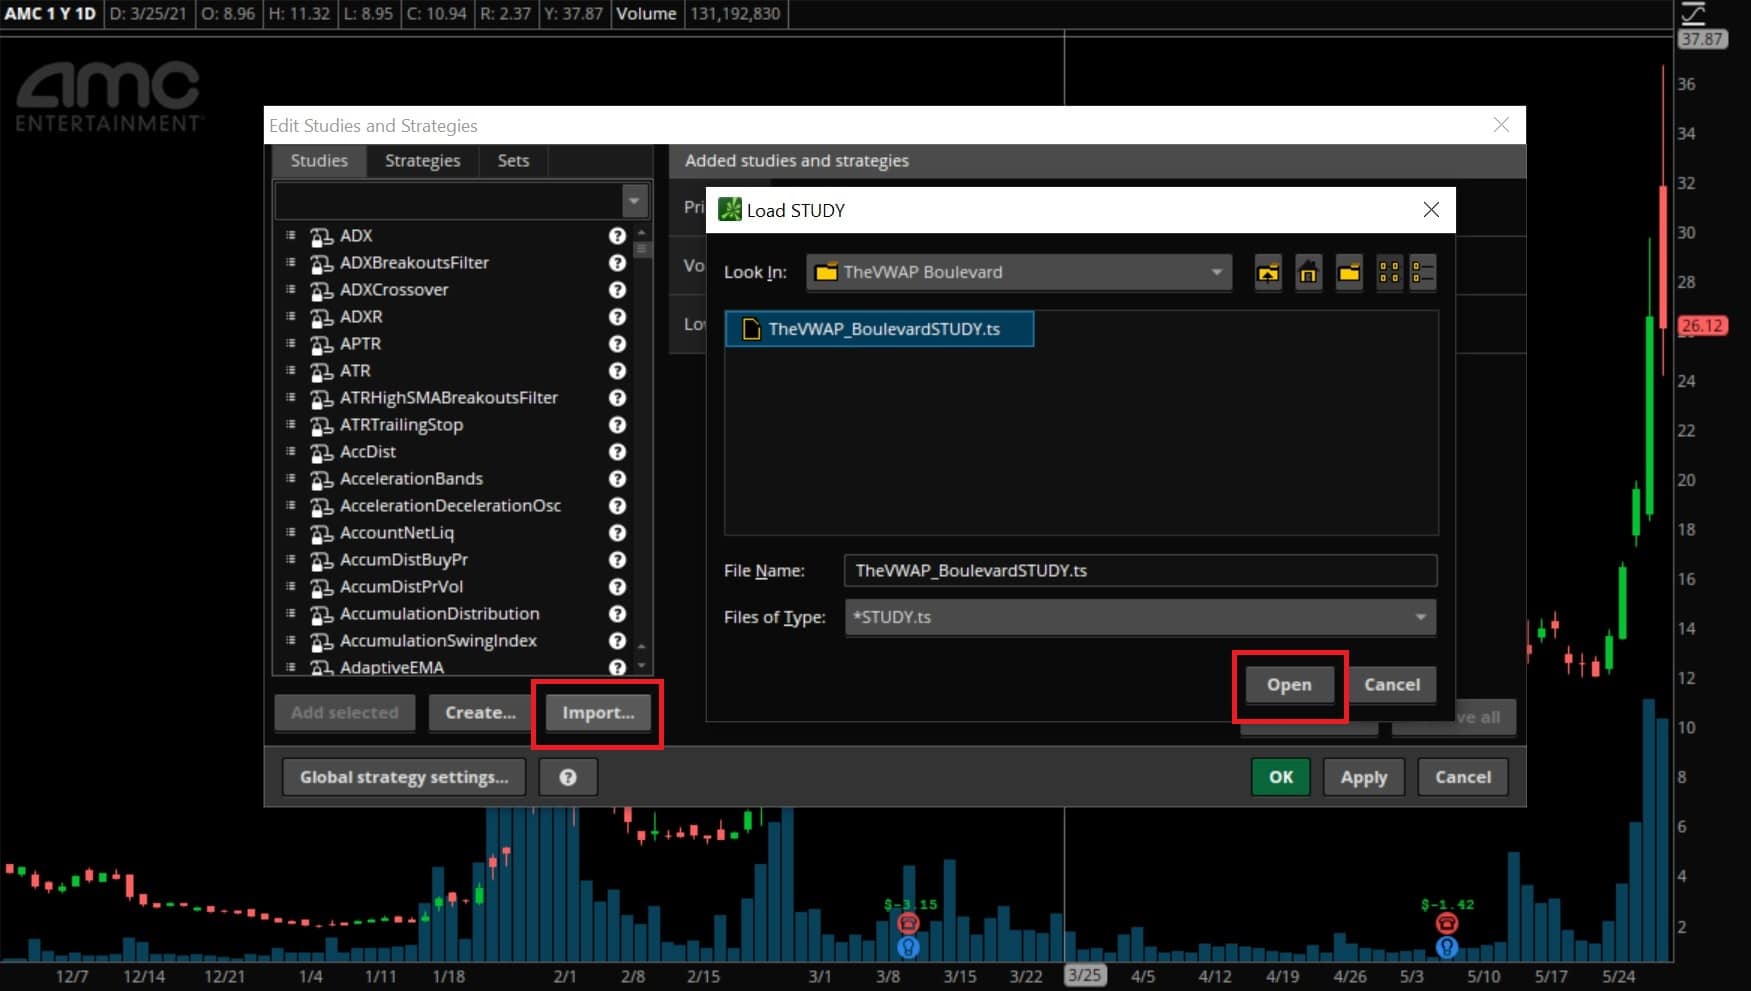
Step 4 – Click “Import…” to pull up the “Load STUDY” window and browse through the drop-down menu to locate the unzipped folder saved on your computer. Open the folder, highlight the study, and click “Open”.

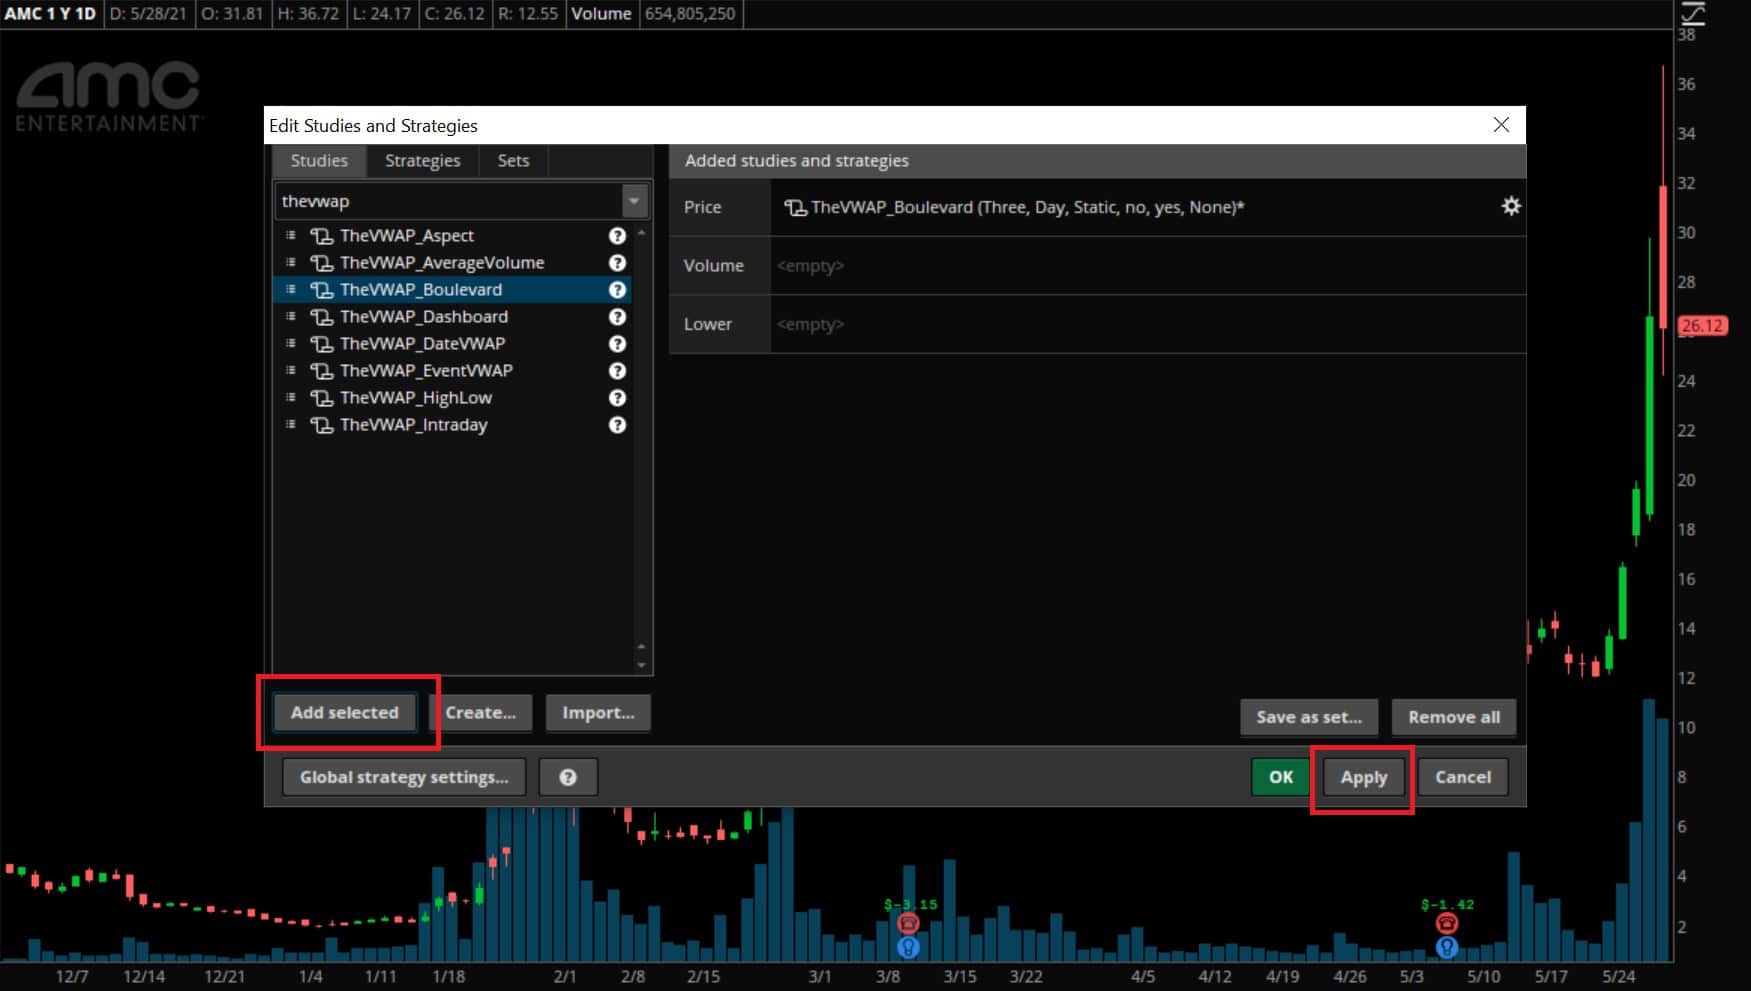
Step 5 – The study has now been loaded onto your platform but you still need to add it to your chart. Use the search bar on the left hand side to find the indicator you just imported — searching for “VWAP” is an easy, quick way. Next, click “Add selected”, and then click “Apply”.

Step 6 – Success! You’ve added VWAP Boulevard to your platform and can now play around with the built-in settings.

We’ll send you Boulevard for free, plus a tutorial of its features and settings.
