VWAP Boulevard for TradingView

Get our free VWAP indicator and read the import instructions.
Effective on multiple timeframes, VWAP Boulevard auto-detects the three highest-volume candles in a chart’s
history and launches both static and continuous VWAPs from each of the identified anchor points.
Please read the sections below for some important things to consider and a relevant tutorial.
Important Considerations
When on a non-Daily timeframe, Boulevard finds the three highest volume BARS in the selected search
range, not DAYS — hence the (dismissable) warning label in the chart’s upper right. To follow ADF’s
approach, you’ll need to focus on the Daily chart, checking lower timeframe Boulevards only
when needed. Non-Daily timeframes can be disabled in the Visibility tab as desired. One way to retain Daily
Boulevard levels on smaller timeframes is this workaround.
Please make sure “Scale Price Chart Only” is turned on in your chart settings. Right-click the
price axis of any chart — “Scale Price Chart Only” will be the fourth option listed in the displayed menu.
This prevents far-off Boulevard levels from messing with the scaling of your chart (as the chart normally
expands to show indicator levels, even far-away).
Using Horizontal Rays
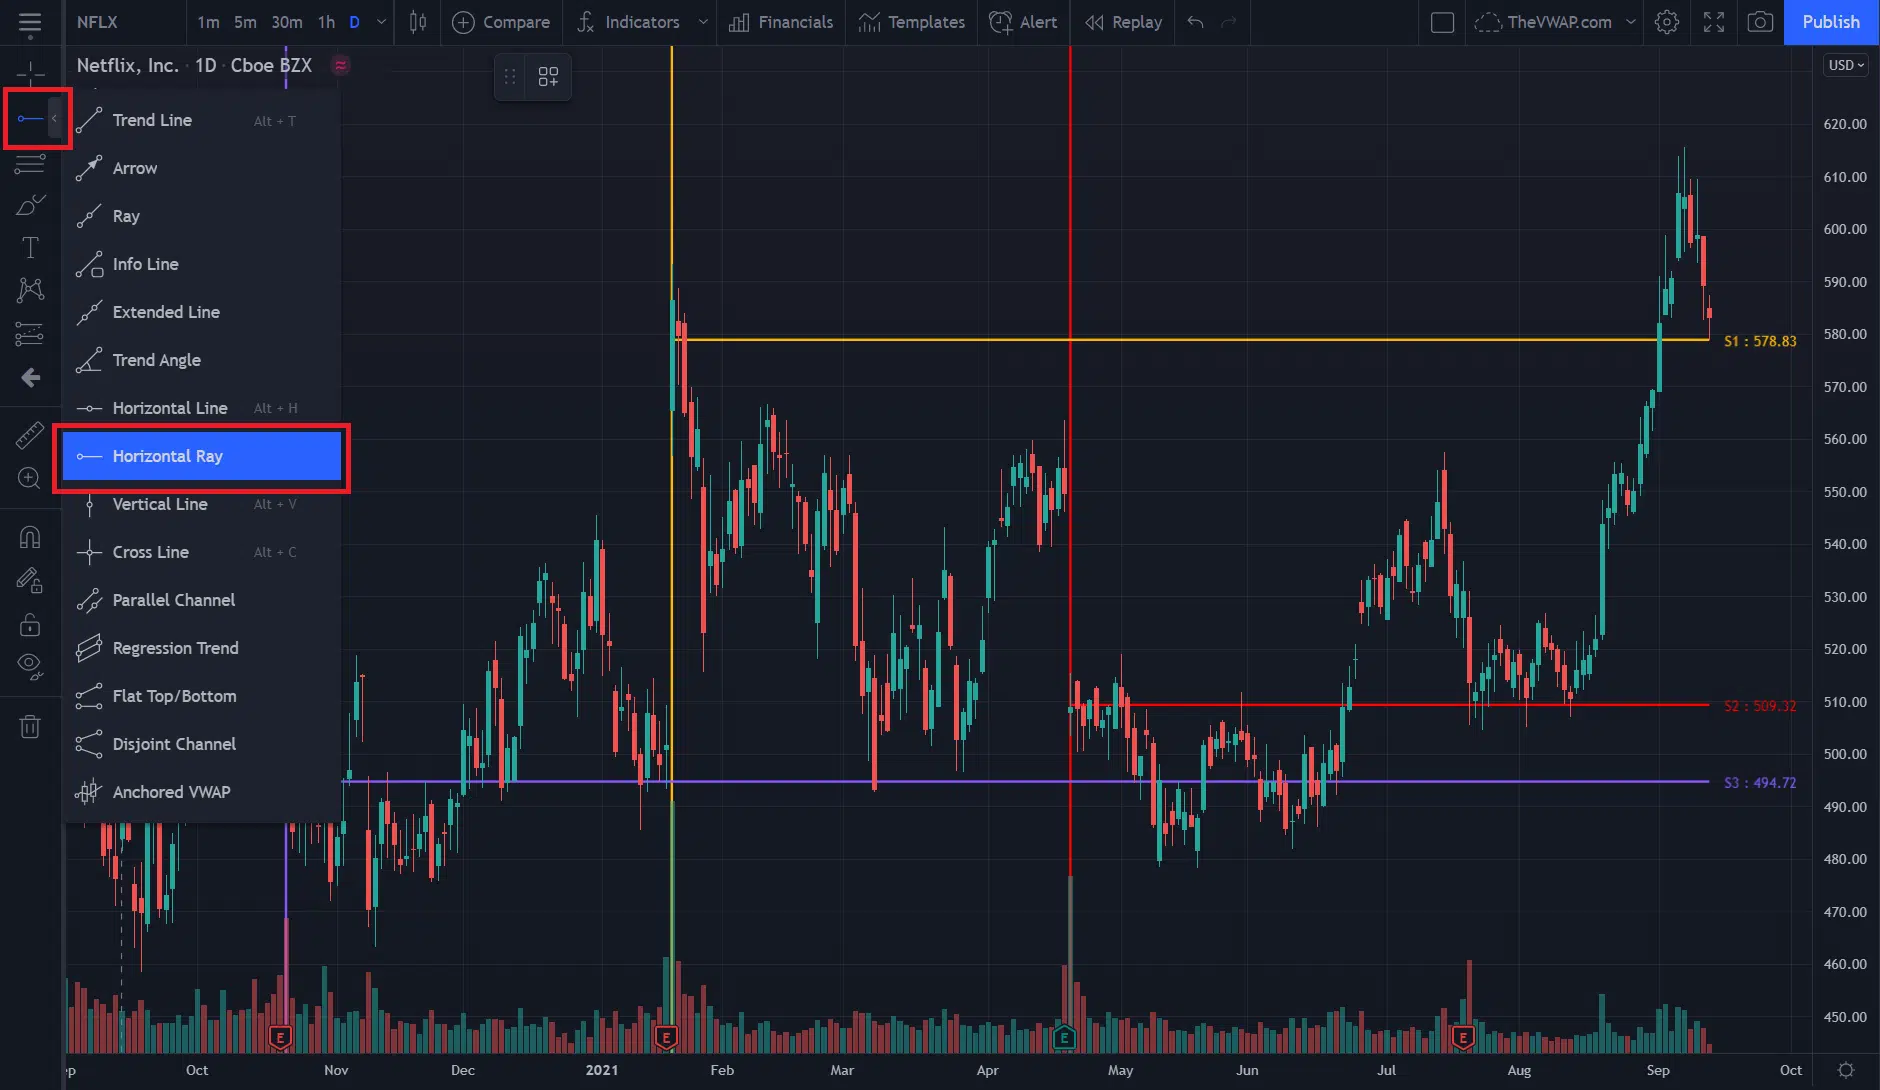
Step 1 — Click the drawing tools icon on your chart’s side menu and select “Horitzontal Ray”.

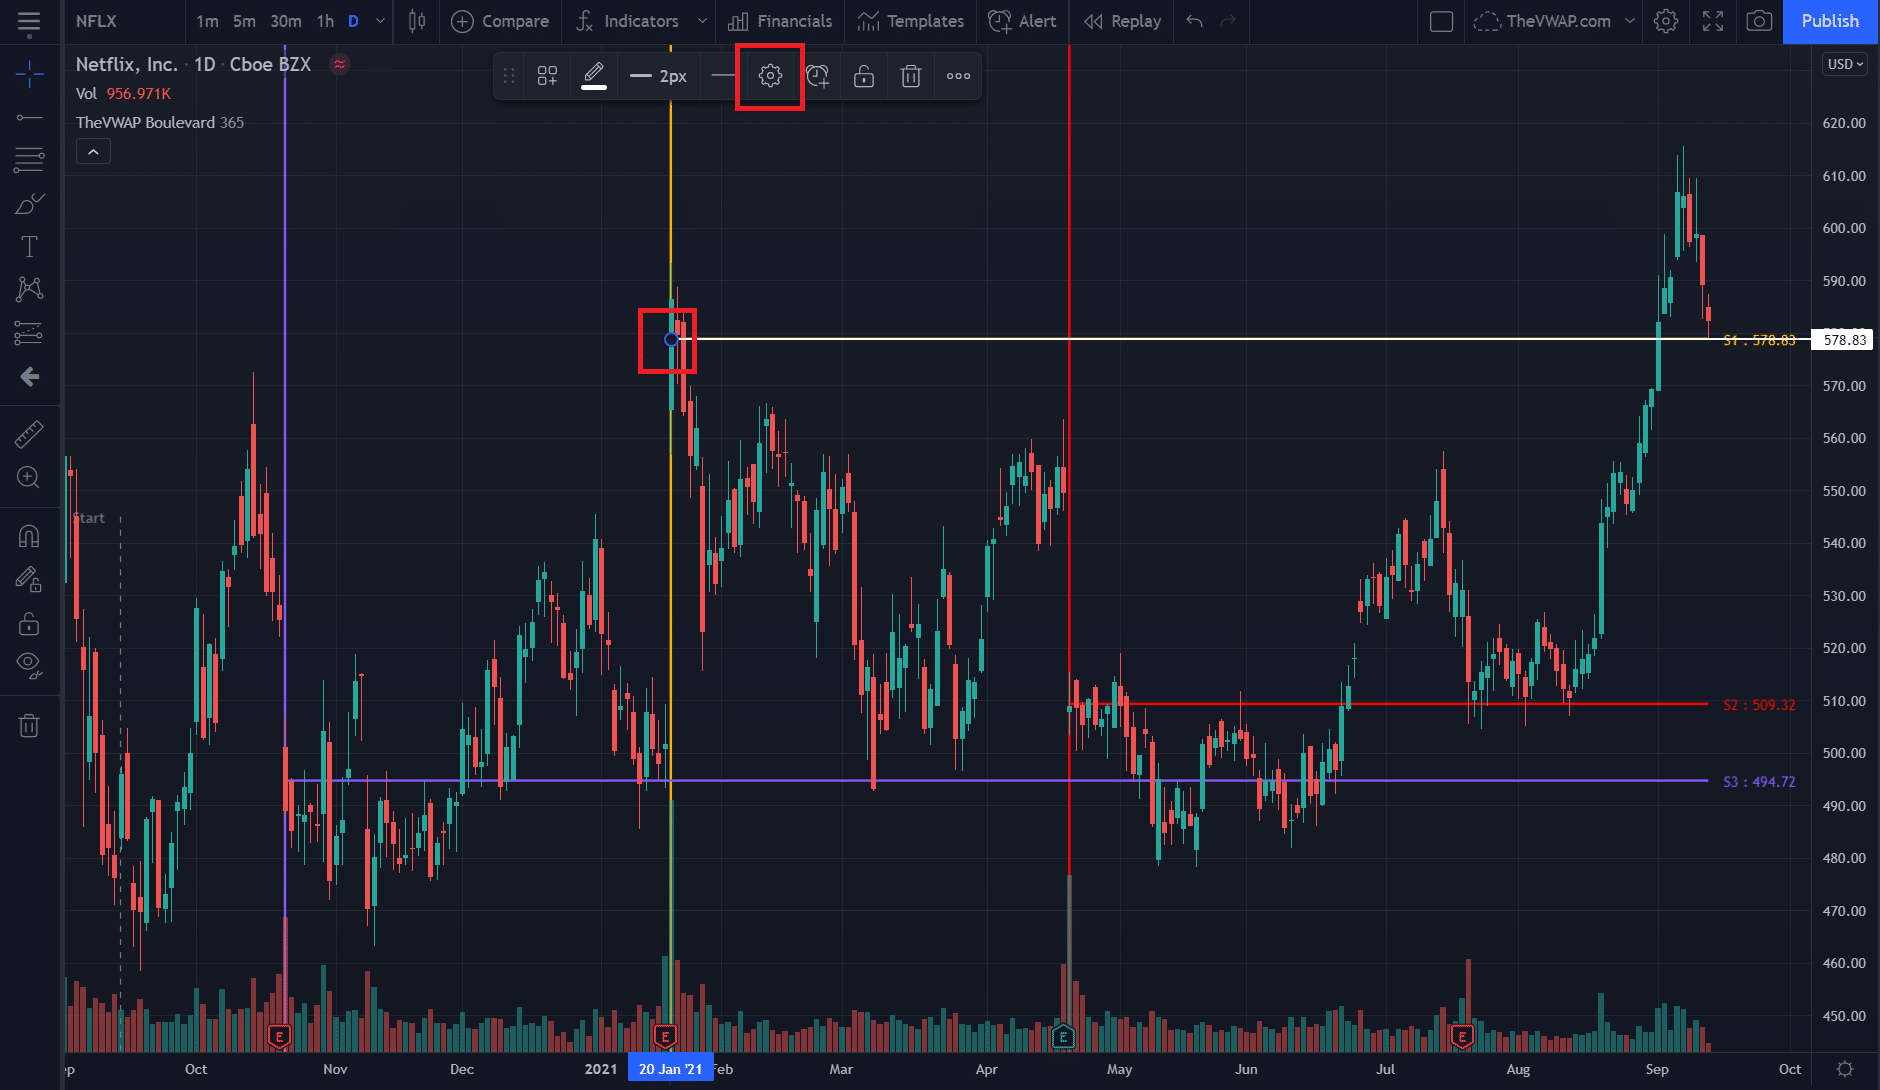
Step 2 — With the drawing tool selected, click as close as you can to one
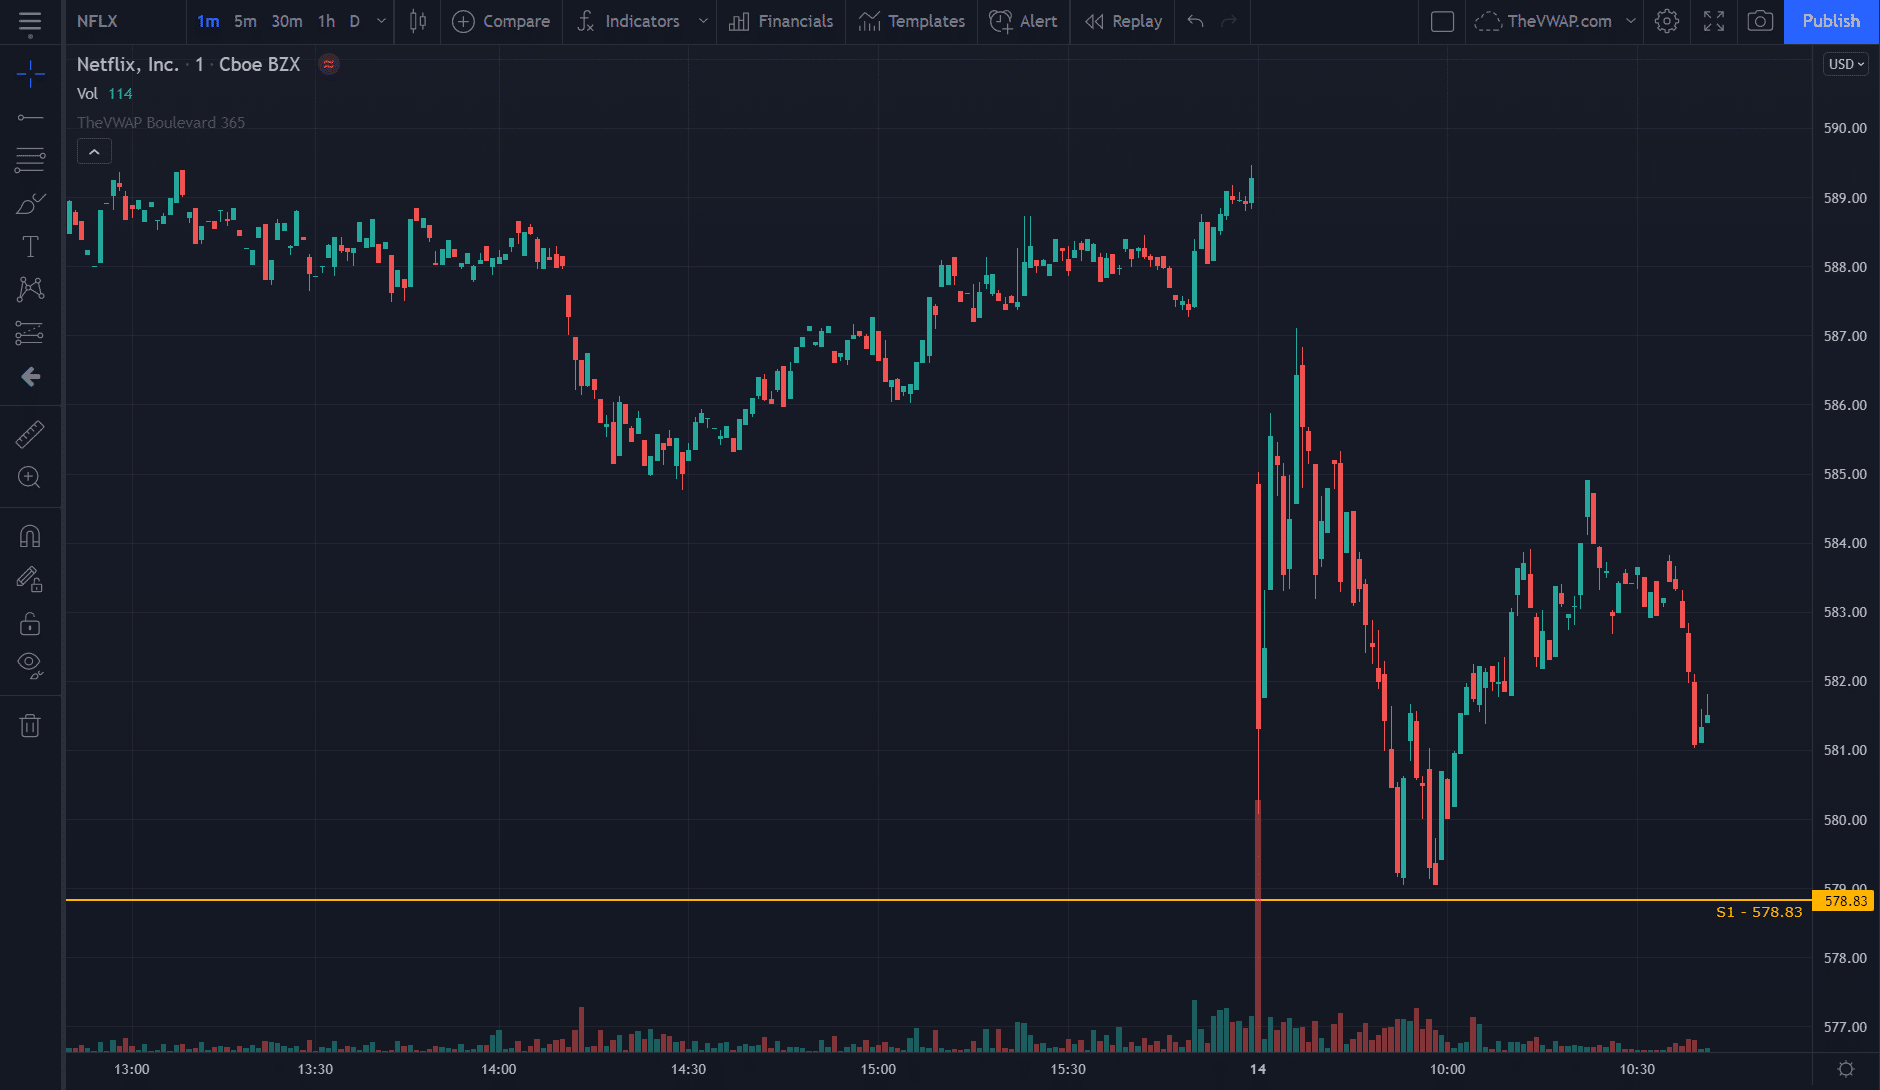
of the three Boulevard levels. This will create a one-directional line that extends all the way to the right
side of your chart, and will be visible on all timeframes.
Then, click the gear icon in the drawing tools menu to open the Horizontal Ray settings.

Step 3 — In those settings you’ll be able to change the color of the line,
if/where you’d like it to be labeled, and the exact price coordinates of the line. Ensure that the
coordinates match the Boulevard level you’re attempting to recreate.
After making your desired changes, switch to any other timeframe to verify the line is still present. If
you’ve already turned off Boulevards for all timeframes besides Daily, the only line on your chart should be
the one you just created.
Repeat these steps for all three Boulevard levels if desired, and if your chart layout is saved then these
Horizontal Rays will be present everytime you reload the same symbol. You won’t need to adjust them unless
the value of one of the Boulevards changes.

We’ll send you Boulevard for free, plus a tutorial of its features and settings.
