VWAP Boulevard Indicator
Available for free on thinkorswim and TradingView. Select your preferred platform.
thinkorswim
TradingView
Never heard of VWAP Boulevard? Here's an overview.
The easiest way to familiarize yourself with VWAP Boulevard is to watch this interview with one of our
chatroom
moderators — James Ferreira. In the interview James discusses the basics, goes over several chart examples, and
details how he personally uses the indicator in his own trading.
Popularized by AllDayFaders (@team3dstocks), the
original idea behind VWAP Boulevard is straightforward:
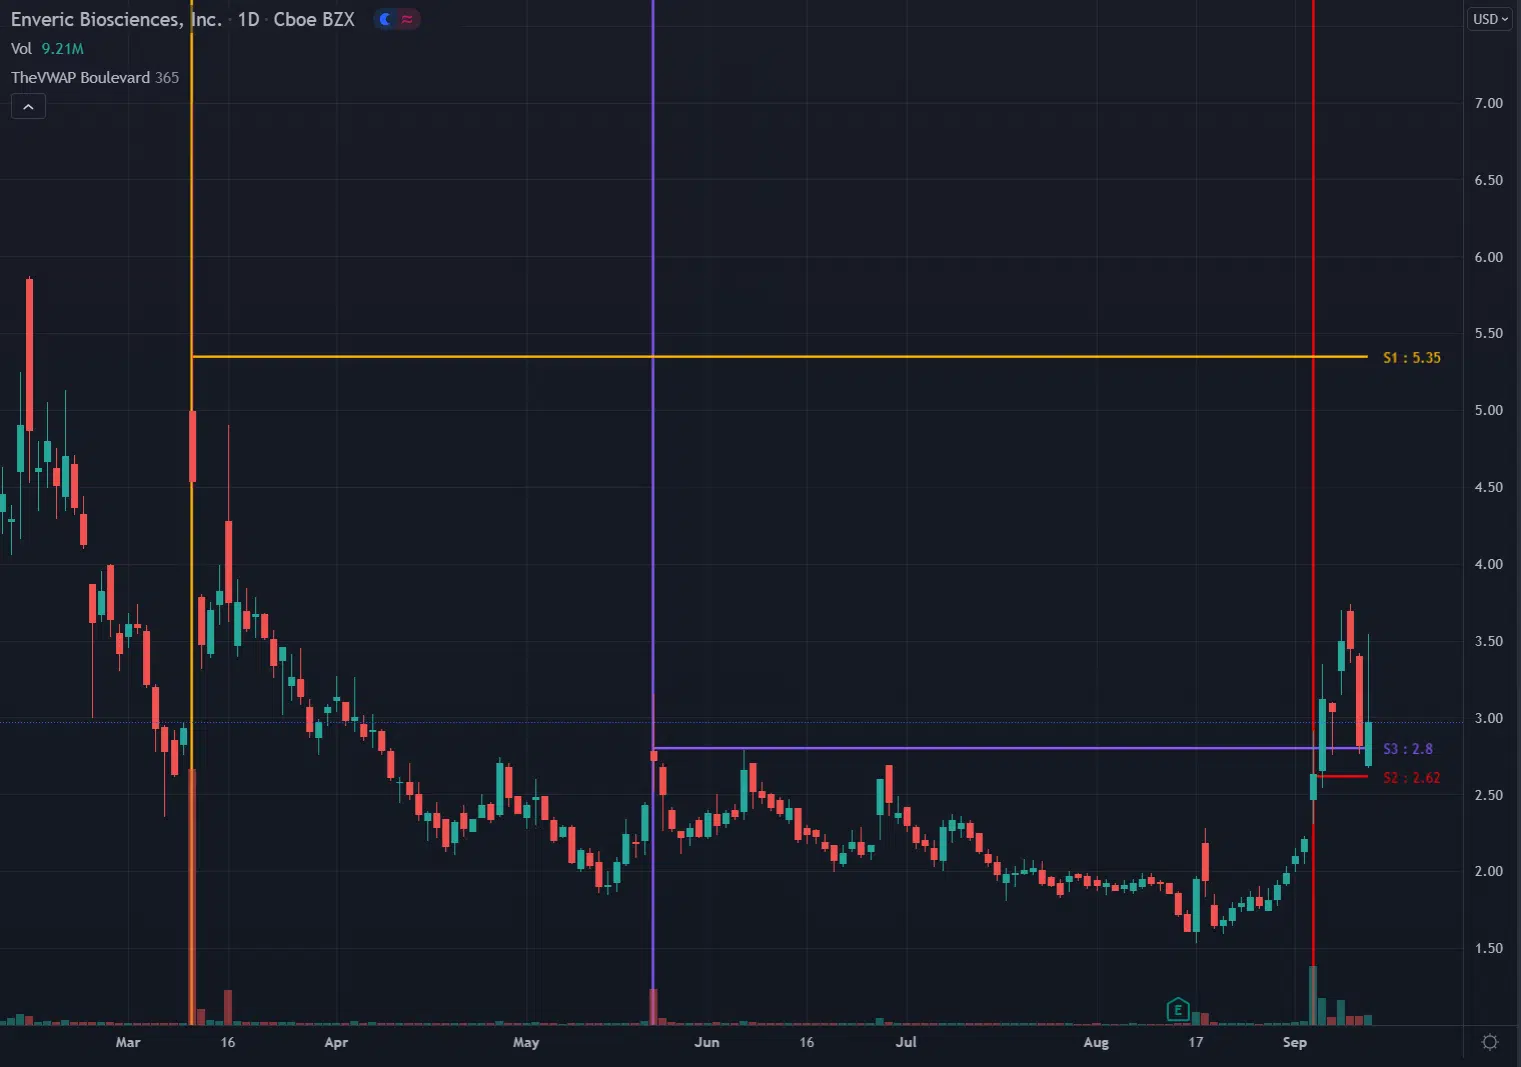
1. Identify the highest-volume days in a chart's history (typically 1-3).
2. Determine the closing value of the intraday volume-weighted average price on those days.
3. Draw a static line on your chart at those identified price levels.
Those static lines can then be used as ongoing reference points for potential support/resistance when price
trades back up/down to those identified levels. Here's a short summary from ADF himself.
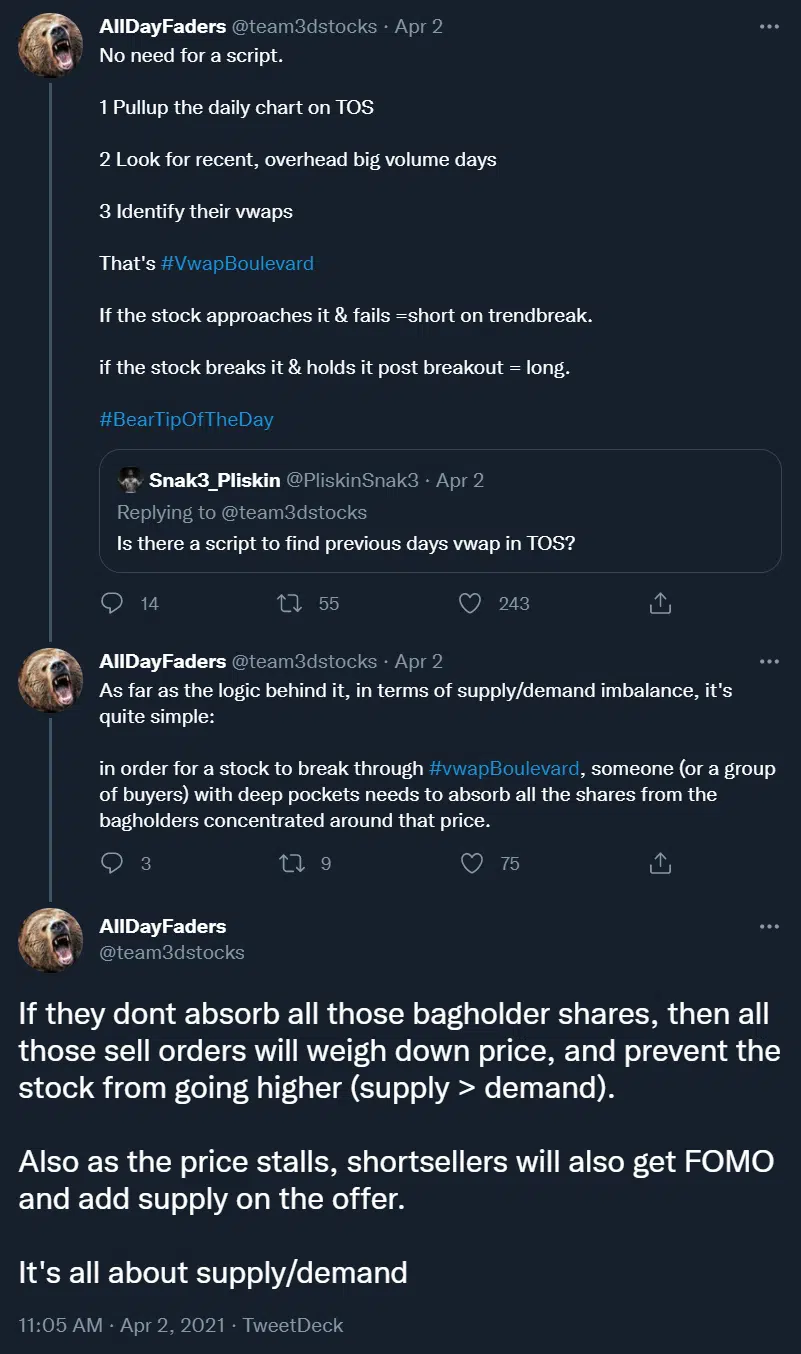
So if there's no need for a script, why create one?
First and foremost — we're obsessed with VWAP. Our founder, Zach Hurwitz, has been coding and creating
advanced applications of VWAP for over a decade now, so when he heard of Boulevard he was instantly
intrigued.
In addition to the use of standard deviation bands on an intraday VWAP, we're big fans of anchoring
VWAPs to significant events in a chart's history and have been doing so for years. Earnings reports, technical gaps, and
high-volume days are only a few examples. However, since we've always been partial to the use of
continuous VWAPs — rather than static plots from past days — naturally, our curiosity was
piqued.
Additionally, just because you don't NEED an indicator to accomplish something doesn't mean it's not
nice to have. Time is precious in trading, and having a tool that prevents you from having to manually
identify the levels you're seeking on every new chart is immensely helpful.
We released our Boulevard script for thinkorswim back in June of 2021, and after working closely with an
incredible Pine Script programmer we now have a version available for TradingView as well.
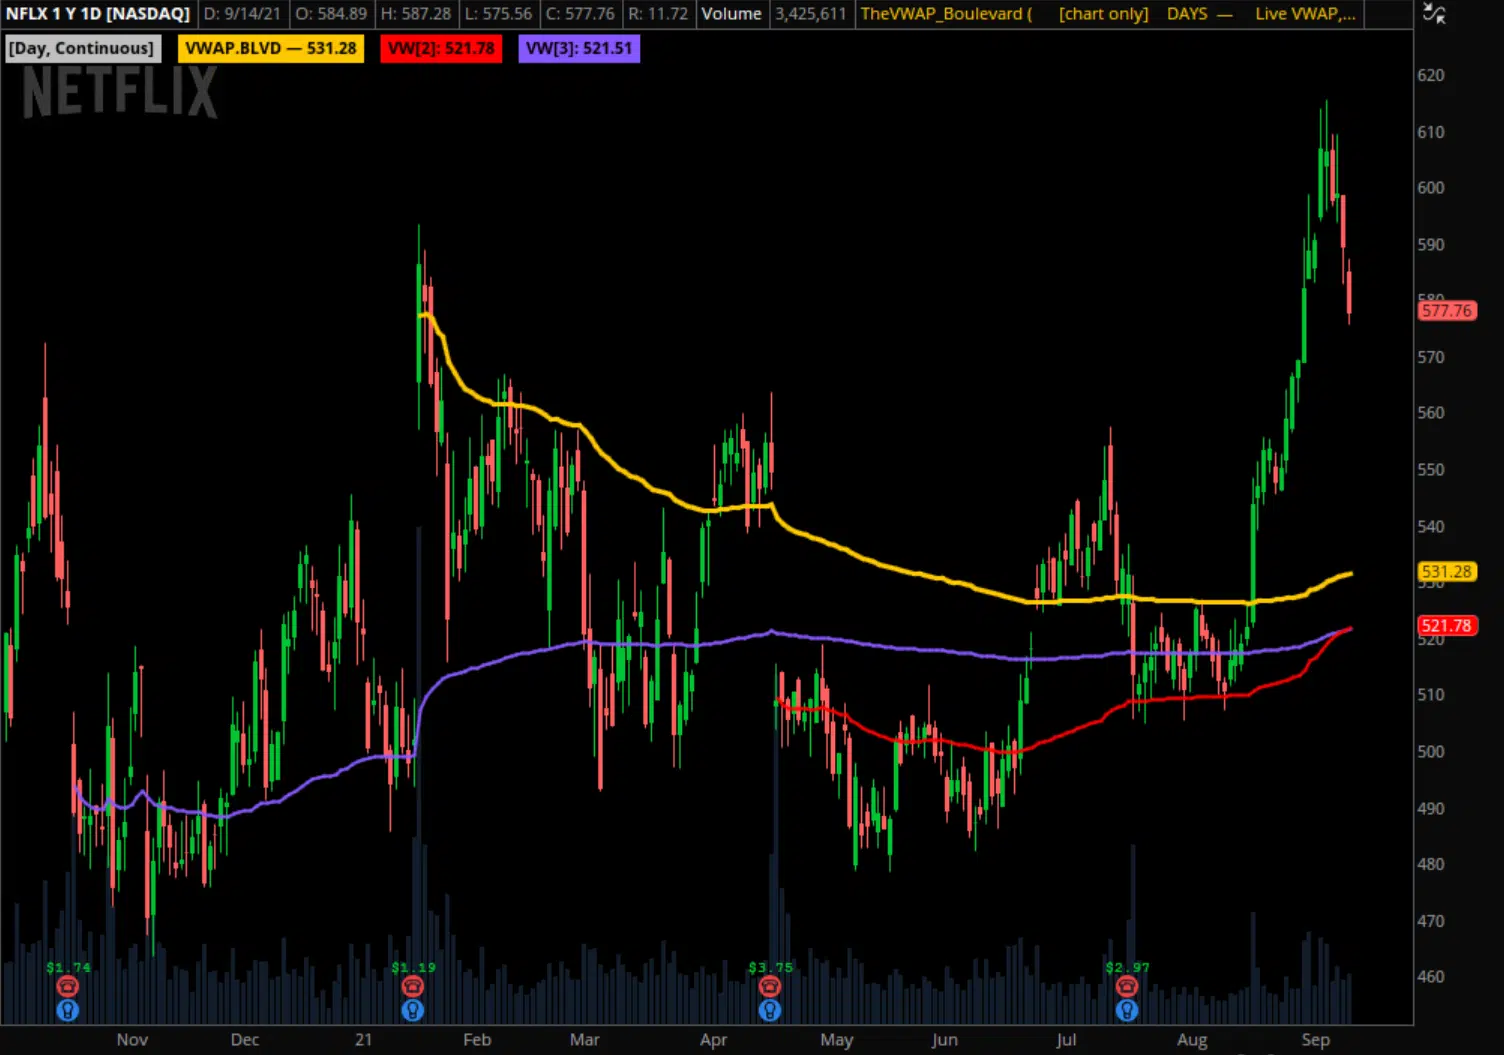
Both versions will automatically locate up to three of the highest-volume days in a chart's history, determine
their end-of-day intraday VWAP values, and plot a static line at the identified values.
And because we're VWAP aficionados ourselves, we added on some additional functionality. You're also able to
anchor continuous VWAPs to those same high-volume days if you wish, which can be displayed alongside or in place
of the static Boulevards.
It's great to see more traders discovering the power of VWAP in all of its forms, and we hope these free
tools will encourage you to continue exploring additional uses of VWAP and the positive impact that it can have
on your trading. Be sure to check out our free text guide if you
haven't already.
We'll send you Boulevard for free, plus a tutorial of its features and settings.
We'll send you Boulevard for free, plus a tutorial of its features and settings.